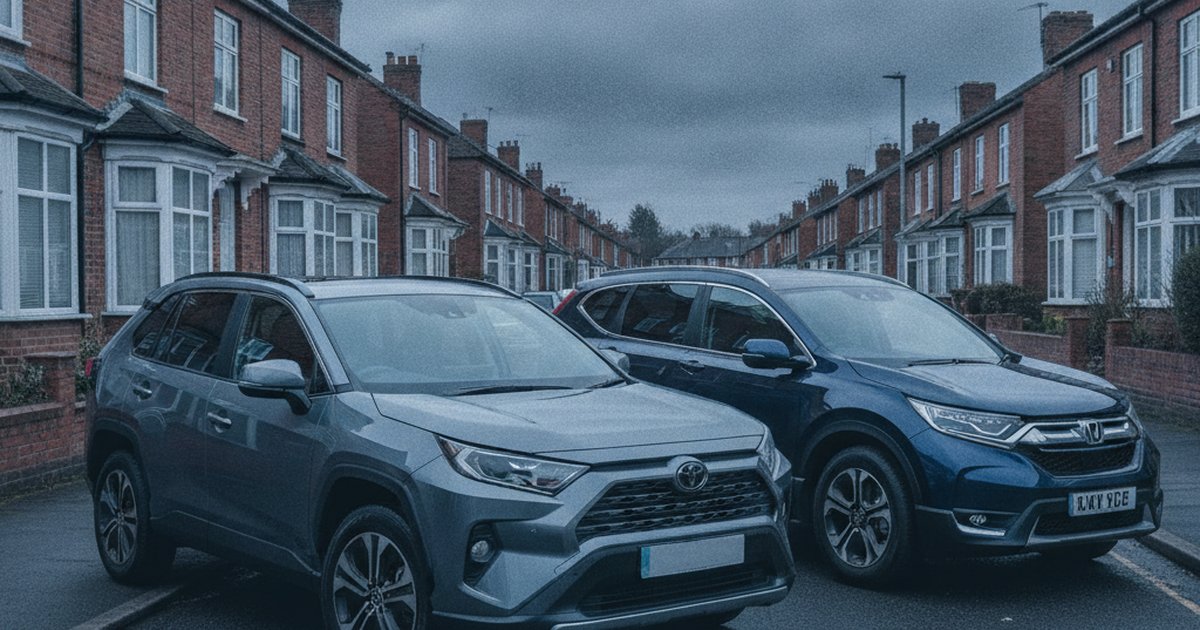
The RAV4 and CR-V have spent three decades fighting over the same driveways: retirees who want a high seating position without a proper 4x4, and families who need something that will shrug off school runs, dog hair and roof boxes for a decade without complaint. Both have reputations as the sensible, boring, brilliant choice. But reputations are built on marketing as much as on facts.
We pulled 1,735,810 MOT tests covering both models across their shared production years of 2010 to 2022, using DVSA test data to see which one actually holds up better on Britain's roads. The result isn't quite the toss-up you'd expect from two cars with near-identical reputations for bulletproof engineering.
The short version: The Honda CR-V comes out on top, beating the Toyota RAV4 by 108 points on our reliability score despite a narrower 1.2 percentage point gap in raw pass rate. The CR-V's advantage comes from consistency across its age range rather than one standout generation, while the RAV4 shows sharper swings between good and mediocre model years.
The Data Verdict
The Honda CR-V is the more reliable car, by 108 points
Like-for-like comparison across the years both cars were on sale (2010-2022), from 1,735,810 real DVSA MOT tests. Scores out of 1000, higher is better.
Head-to-Head: The Numbers (2010-2022)
| Metric | Toyota RAV4 | Honda CR-V |
|---|---|---|
| Reliability score (/1000) | 634 | 742 |
| MOT pass rate | 88.1% | 86.9% |
| First MOT pass rate (age 3) | 90.8% | 91.3% |
| Average defects per test | 1.15 | 1.29 |
| Typical annual mileage | 7,586 mi | 7,282 mi |
| MOT tests analysed | 467,419 | 1,268,391 |
| Vehicles tracked | 79,282 | 140,353 |
Pass Rate and Score, Year by Year
| Year | Toyota RAV4 pass (score) | Honda CR-V pass (score) | Stronger |
|---|---|---|---|
| 2010 | 81.7% (700) | 83.0% (796) | Honda CR-V |
| 2011 | 82.8% (673) | 83.7% (759) | Honda CR-V |
| 2012 | 83.8% (687) | 84.9% (756) | Honda CR-V |
| 2013 | 85.7% (727) | 86.8% (785) | Honda CR-V |
| 2014 | 85.6% (682) | 87.2% (745) | Honda CR-V |
| 2015 | 86.5% (661) | 88.4% (728) | Honda CR-V |
| 2016 | 88.3% (615) | 89.6% (716) | Honda CR-V |
| 2017 | 88.2% (561) | 90.2% (679) | Honda CR-V |
| 2018 | 88.2% (522) | 90.4% (657) | Honda CR-V |
| 2019 | 92.3% (622) | 92.9% (660) | Honda CR-V |
| 2020 | 92.3% (628) | 93.2% (640) | Honda CR-V |
| 2021 | 92.5% (613) | 92.8% (609) | Even |
| 2022 | 94.8% (669) | 93.8% (623) | Toyota RAV4 |
Shared years only. Toyota RAV4 data also covers 2023; Honda CR-V data also covers 2023, covered in the full year-by-year guides below.
What Actually Fails on Each
Recorded defects and advisories per 100 MOT tests by DVSA inspection category, 2010-2022. A test can record more than one defect.
Toyota RAV4
- Tyres, wheels and suspension: 53.1 per 100 tests typically around 52,500 miles
- Brakes: 24.5 per 100 tests typically around 56,500 miles
- Visibility (wipers, washers, windscreen): 8.9 per 100 tests typically around 54,000 miles
- Other: 8.1 per 100 tests typically around 53,000 miles
- Lights and electrics: 6.5 per 100 tests typically around 57,500 miles
Honda CR-V
- Tyres, wheels and suspension: 48.1 per 100 tests typically around 64,000 miles
- Brakes: 20.7 per 100 tests typically around 63,500 miles
- Lights and electrics: 15.5 per 100 tests typically around 69,000 miles
- Other: 11.7 per 100 tests typically around 64,000 miles
- Visibility (wipers, washers, windscreen): 9.3 per 100 tests typically around 65,000 miles
The Best Year to Buy Each
Reliability scores are age-adjusted: each year is judged against other cars of the same age. So when an older year out-scores a newer one, it means it holds up unusually well for its age, not that it will need less work than a much newer car. How our scores work.
Why Does the Honda CR-V Come Out Ahead?
On paper the two are close. Pass rates sit within a couple of points of each other, and both comfortably clear 90% at their first MOT, so neither is falling apart in the first three years of ownership. The gap shows up when you age-adjust the data year by year. The CR-V holds a steadier score across its production run, whereas the RAV4 goes through a rough patch in the mid-2010s where its score drops sharply even as pass rate keeps climbing. That's the sign of a car passing its MOT but picking up more advisories and marginal fails along the way, rather than sailing through clean.
Annual mileage is broadly similar for both, so this isn't a case of one being driven gently and the other thrashed. These are both low-stress, high-mileage-over-time family and retiree cars doing 7,000-plus miles a year. The CR-V's edge looks like it comes down to build quality holding up more evenly as the cars age, not a difference in how hard they're used.
What Do the Defect Patterns Actually Mean for a Buyer?
Both cars fail MOTs for the same reasons in roughly the same order: tyres, wheels and suspension first, brakes second. That's normal for any mid-size SUV carrying extra weight through corners and hauling families around. The RAV4 posts a slightly higher rate of suspension-related defects per 100 tests, while the CR-V's tyres and suspension issues tend to show up later in the car's mileage life, which suggests Honda's underpinnings age a touch more gracefully.
The bigger tell is in lights and electrics. The CR-V records well over double the RAV4's rate here. It's not catastrophic, and it typically doesn't show up until relatively high mileage, but it's worth knowing before you buy: check indicators, headlight alignment and any aftermarket wiring (tow bars, dash cams) carefully on a used CR-V. The RAV4, by contrast, is cleaner on electrics but a little more defect-prone on brakes relative to its mileage, so budget for pad and disc wear slightly earlier.
Neither car shows a dangerous defect rate worth worrying about. This is a fight over wear items and advisories, not safety-critical failures.
Which Years Should You Buy, and Which Should You Avoid?
Both cars share the same standout year: 2013 comes out as the best-scoring pick for each model within this shared window, though at that age you're still buying a car that will need attention to tyres and brakes regardless of badge. Treat it as a value pick that holds up unusually well for its age, not as a car that needs less maintenance than a newer example.
For the RAV4, the score dips notably through 2016 to 2018 even as pass rates keep improving, which is worth digging into before you commit to one of those model years. The CR-V follows a similar late-2010s softening, though less pronounced. If you want the full breakdown of strong and weak years for each, our full Toyota RAV4 year-by-year breakdown and our full Honda CR-V year-by-year breakdown go through every year in detail, including which ones to steer clear of. Whichever you're considering, always run the specific registration through a proper history check first. A model-wide trend tells you the odds, not the outcome for the individual car in front of you.
Which Car Suits Which Kind of Buyer?
If you're a retiree or downsizing to one car and want the best odds of a trouble-free ownership experience with the fewest surprise electrical gremlins, the RAV4 is the tidier long-term bet on that specific front, even though it trails on the overall score. Its brake wear pattern is predictable and its lower electrics defect rate means fewer fiddly warning-light trips to the garage.
If you're running a family SUV hard for years and want the model with the stronger overall reliability track record across its full age range, the CR-V is the one the data backs. Just get the lights, indicators and any towing electrics checked thoroughly on a used example, particularly once it's covered real miles. Both are the kind of car What Car? owner satisfaction surveys consistently rank near the top of the SUV class, and both will comfortably outlast plenty of flashier rivals. This is a fight between two genuinely good cars, not a good car versus a bad one.
Frequently Asked Questions
Is the Toyota RAV4 more reliable than the Honda CR-V?
Not in this dataset. Across 1,735,810 shared MOT tests from 2010-2022, the Honda CR-V scores higher overall, beating the RAV4 by 108 points despite the two being only 1.2 percentage points apart on raw pass rate.
Which Toyota RAV4 years should you avoid?
The RAV4's score dips noticeably through 2016 to 2018 even though pass rates were improving in that period, which points to more advisories and marginal issues. See our full RAV4 year-by-year breakdown for details on every model year.
Which Honda CR-V years should you avoid?
The CR-V shows a softer version of the same late-2010s dip seen in the RAV4, though less pronounced. Our full CR-V year-by-year breakdown covers which specific years hold up best and worst.
Which is cheaper to run, the RAV4 or the CR-V?
Both have similar annual mileage profiles, which points to similar ownership patterns. The RAV4's lower electrics defect rate may mean fewer unexpected small repair bills, while the CR-V's stronger overall reliability score points to fewer major issues over time.
Which is the better first car for a new driver?
Neither is a typical first car choice given their size and running costs, but if you're choosing between them for a young or inexperienced driver, the RAV4's lower rate of electrical faults and predictable brake wear make it slightly easier to live with day to day.
Our Verdict
A reliable model is only half the story. The exact Toyota RAV4 or Honda CR-V you are looking at could be clocked, on outstanding finance, or a past write-off. Check the specific car before you commit.
Both of these SUVs earned their reputations honestly, but the data gives the CR-V the edge overall. Before you buy either, run the exact registration through the official DVSA MOT history checker and then get the full picture with a PlateInsight report. New users get 5 free credits to check a vehicle's complete MOT and defect history before they commit.
You might also like
Check Any Vehicle's Full History
MOT results, mileage timeline, AI health score, and market valuations. New users get 5 free credits.