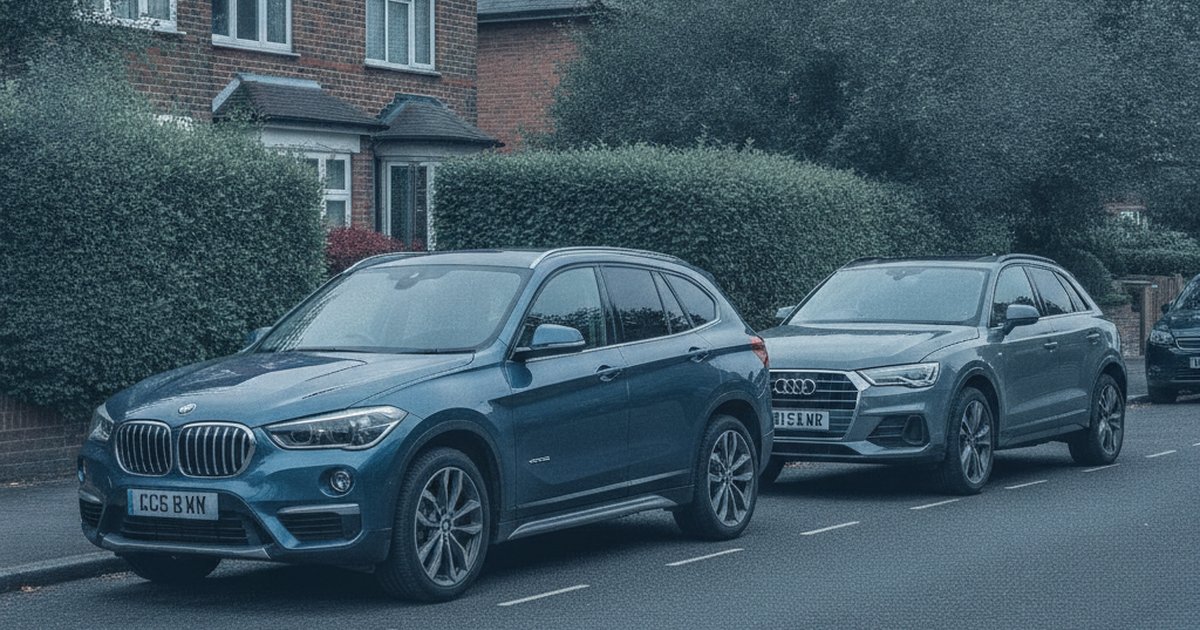
The BMW X1 and Audi Q3 sit in the same driveway conversation: a small premium SUV that says you've done well without saying you've spent a fortune on a full-size X5 or Q7. Buyers cross-shop them constantly, usually deciding on badge preference, lease deal, or which showroom had the better coffee. We looked at 1,657,474 MOT tests covering both models across their shared 2011-2020 production years to see whether either one actually deserves the premium price tag, or whether you're just paying for the badge.
There is a winner here, and it isn't the one most people assume.
The short version: The Audi Q3 comes out ahead of the BMW X1, though the margin on pass rate is thin. The Q3 posts a notably stronger first MOT pass rate, suggesting fewer early-life niggles, but it also racks up more defects per test overall once age catches up with both cars. Neither is a bad buy. This is a case of picking the less troublesome of two similarly-priced premium crossovers.
The Data Verdict
The Audi Q3 is the more reliable car, by 30 points
Like-for-like comparison across the years both cars were on sale (2011-2020), from 1,657,474 real DVSA MOT tests. Scores out of 1000, higher is better.
Head-to-Head: The Numbers (2011-2020)
| Metric | BMW X1 | Audi Q3 |
|---|---|---|
| Reliability score (/1000) | 642 | 672 |
| MOT pass rate | 86.2% | 86.8% |
| First MOT pass rate (age 3) | 88.6% | 91.3% |
| Average defects per test | 1.20 | 1.39 |
| Typical annual mileage | 7,325 mi | 7,315 mi |
| MOT tests analysed | 766,131 | 891,343 |
| Vehicles tracked | 95,941 | 107,527 |
Pass Rate and Score, Year by Year
| Year | BMW X1 pass (score) | Audi Q3 pass (score) | Stronger |
|---|---|---|---|
| 2011 | 82.1% (679) | 84.2% (752) | Audi Q3 |
| 2012 | 82.3% (655) | 83.5% (714) | Audi Q3 |
| 2013 | 83.4% (646) | 84.3% (694) | Audi Q3 |
| 2014 | 83.3% (599) | 85.4% (679) | Audi Q3 |
| 2015 | 86.0% (633) | 86.4% (661) | Audi Q3 |
| 2016 | 88.7% (680) | 87.5% (649) | BMW X1 |
| 2017 | 89.1% (645) | 89.6% (660) | Audi Q3 |
| 2018 | 89.1% (613) | 89.8% (637) | Audi Q3 |
| 2019 | 90.4% (616) | 92.1% (678) | Audi Q3 |
| 2020 | 91.1% (613) | 90.9% (676) | Audi Q3 |
Shared years only. BMW X1 data also covers 2010, 2021-2022, covered in the full year-by-year guides below.
What Actually Fails on Each
Recorded defects and advisories per 100 MOT tests by DVSA inspection category, 2011-2020. A test can record more than one defect.
BMW X1
- Tyres, wheels and suspension: 55.1 per 100 tests typically around 55,500 miles
- Brakes: 21.1 per 100 tests typically around 59,000 miles
- Other: 11.1 per 100 tests typically around 56,500 miles
- Lights and electrics: 8.9 per 100 tests typically around 62,500 miles
- Visibility (wipers, washers, windscreen): 7.0 per 100 tests typically around 58,500 miles
Audi Q3
- Tyres, wheels and suspension: 67.9 per 100 tests typically around 56,500 miles
- Brakes: 28.9 per 100 tests typically around 56,000 miles
- Other: 12.0 per 100 tests typically around 57,000 miles
- Lights and electrics: 6.9 per 100 tests typically around 63,500 miles
- Visibility (wipers, washers, windscreen): 5.9 per 100 tests typically around 59,500 miles
The Best Year to Buy Each
Reliability scores are age-adjusted: each year is judged against other cars of the same age. So when an older year out-scores a newer one, it means it holds up unusually well for its age, not that it will need less work than a much newer car. How our scores work.
Why Does the Audi Q3 Beat the BMW X1?
On raw pass rate the two are close enough that you shouldn't buy one over the other based on that figure alone. Where the Q3 pulls ahead is at the point that matters most to a buyer: the first MOT. A car's first test at three years old is the cleanest read you'll get of how well it was built and how well the first owner looked after it, before wear and neglect start compounding. The Q3's first MOT pass rate is meaningfully higher than the X1's, which tells you Audi's early build quality on this generation was the stronger of the two.
Interestingly, the X1 actually generates fewer defects per test than the Q3 across the full window. So the Q3 isn't the mechanically cleaner car test after test, it just gets through that critical first hurdle more often. That's a useful distinction: the X1's problems tend to build up with age and mileage, while the Q3's issues are spread more evenly but rarely enough to fail it outright in the early years.
Annual mileage is almost identical between the two, so this isn't a case of one being driven gently by cautious professionals and the other thrashed by high-mileage reps. Whatever gap exists comes down to the cars themselves, not who's buying them.
What Do the Defect Patterns Actually Tell You?
Both cars fail for the same reasons, in the same order: tyres, wheels and suspension first, brakes a distant second, then a long tail of lights, wipers and emissions issues. That's a normal profile for any car with run-flat-adjacent tyre setups and firm sport-oriented suspension, both of which are common across these ranges.
The Q3 throws up suspension and brake defects at a higher rate per 100 tests than the X1. That's not necessarily a reliability black mark on its own, wear items are wear items, and Audi's quattro all-wheel-drive system on many Q3s puts extra load through drivetrain and suspension components that a front-driven or lighter rear-biased X1 doesn't see in the same way. It does mean Q3 owners should budget slightly more attention (and cash) for tyres and brakes over a long ownership period, even if the car is passing its MOTs more comfortably overall.
The X1's lower defects-per-test figure combined with its weaker pass rate is the more telling pattern. It suggests that when an X1 does fail, it's more likely to be for something that stops the test in its tracks rather than a scattergun of minor advisories. Worth knowing if you're buying one that's due an MOT shortly.
Key point: Neither car shows an alarming dangerous defect rate in this data, so this comes down to wear costs and day-to-day fault frequency rather than a genuine safety gap between the two.
Which Years Should You Buy, and Which Should You Avoid?
Both cars follow the pattern you'd expect: age-adjusted scores are strongest at the older end of the window and soften gradually toward 2018-2020, when both ranges were nearing the end of their model cycles and being replaced by newer platforms. That doesn't mean a 2011 example is mechanically fresher than a 2019 one, an older car still carries more wear regardless of how well it scores against its own age group, but it does mean the earliest cars in this window held up unusually well for cars of that age.
For the X1, the standout is the pre-window 2010 model, which scores well ahead of anything in the shared range, with the 2016-2017 cars also a reasonable middle-ground pick if you want something newer with a still-respectable pass rate. The weakest patch for the X1 sits around 2013-2014, where pass rate holds up but the age-adjusted score dips noticeably. For the full breakdown of which specific years to target or avoid, see our full BMW X1 year-by-year breakdown.
The Q3's strongest year in this window is 2011 itself, though with a much smaller sample than the mid-cycle years, so treat that as a promising signal rather than gospel. From 2016 onwards the Q3's scores dip and then recover again by 2019, which had both a strong pass rate and a solid age-adjusted score, making it one of the better later picks in the range. Full year-by-year detail is in our full Audi Q3 year-by-year breakdown.
Whichever you choose, always run an MOT history check on the specific car rather than relying on model-wide trends. A tidy 2013 Q3 will always beat a neglected 2019 one.
Which Car Suits Which Kind of Buyer?
If you want the marginally safer bet on paper, particularly for a first premium car where you don't yet know the warning signs of an expensive fault brewing, the Q3's stronger early-life pass rate makes it the steadier choice. Its higher defect rate per test means you should budget for more frequent small bills, tyres and brakes especially, but it's less likely to catch you out with a serious first-MOT failure.
The X1 suits someone who's owned a BMW before, knows the marque's quirks, and is comfortable buying an older, well-scoring example like the earliest cars in this range rather than chasing a newer one. Running costs and insurance groups are broadly comparable between the two ranges at this size and age, so don't expect either badge to save you meaningfully on premiums; check quotes with the AA or your own insurer before committing either way.
Neither car is one to avoid outright. This is a case of the Audi edging it on the numbers that matter most for buyer confidence, not the BMW being a bad car.
Frequently Asked Questions
Is the BMW X1 more reliable than the Audi Q3?
No. Across 1,657,474 shared MOT tests, the Audi Q3 comes out ahead of the BMW X1, driven mainly by a notably stronger first MOT pass rate. Overall pass rates are close, but the Q3's early-life reliability is the deciding factor.
Which BMW X1 years should you avoid?
The 2013-2014 X1s show the weakest age-adjusted scores in the shared window, even though their pass rates hold up reasonably. The standout year is the pre-window 2010 model. See our full BMW X1 year-by-year breakdown for details on every year.
Which Audi Q3 years should you avoid?
Q3 scores dip through 2016-2018 before recovering in 2019, which is one of the stronger later picks. Early 2011 cars score highest but on a much smaller sample. Check our full Audi Q3 year-by-year breakdown before choosing a specific year.
Will insurance and running costs differ much between the two?
Not meaningfully based on this data. Both models are driven similarly (around 7,300 miles a year) and sit in comparable premium-crossover territory for parts and labour costs. The Q3's higher brake and suspension defect rate suggests slightly more frequent wear-item bills.
Which is better as a first premium car?
The Q3, on this data. Its higher first MOT pass rate means fewer early ownership surprises, which matters more to a first-time premium buyer than the X1's marginally lower defect count per test.
Our Verdict
A reliable model is only half the story. The exact BMW X1 or Audi Q3 you are looking at could be clocked, on outstanding finance, or a past write-off. Check the specific car before you commit.
Badge snobbery aside, the data gives the Audi Q3 the edge here, but it's a close-run thing and both cars are viable used buys if you pick the right year and check the individual car's history. Before you commit to either, run the specific registration through PlateInsight. You get 5 free credits to check full MOT history, mileage patterns and past defects on the exact car you're considering, not just the model average.
You might also like
Check Any Vehicle's Full History
MOT results, mileage timeline, AI health score, and market valuations. New users get 5 free credits.