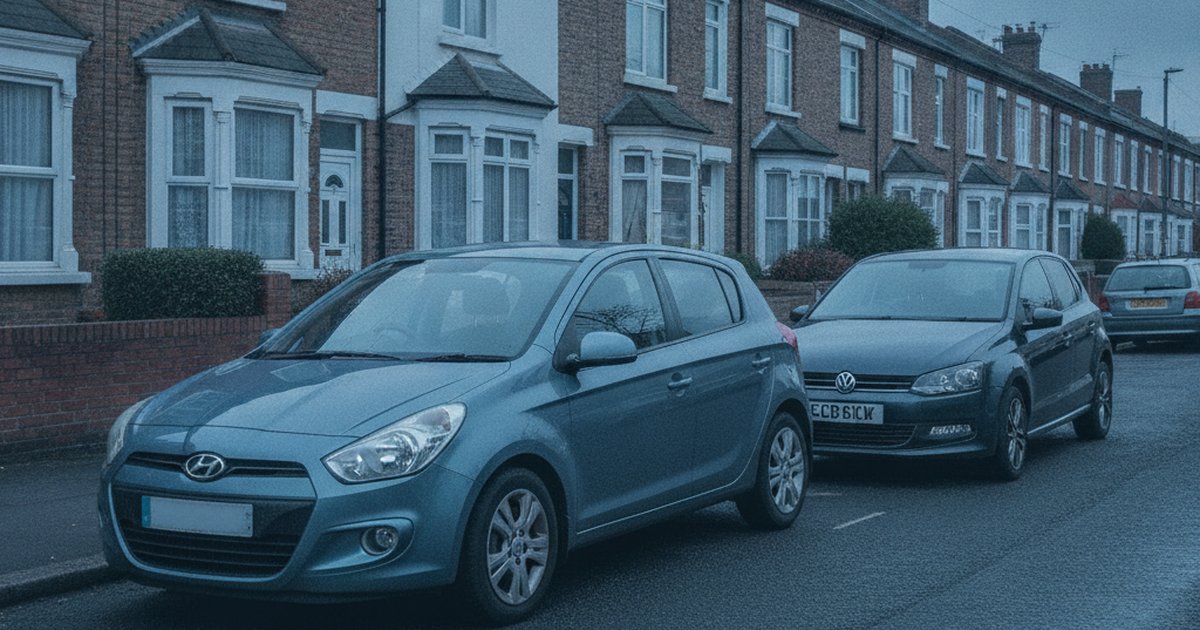
The i20 and Polo have been fighting for the same buyer for over a decade: someone who wants a small, sensible car that won't cause drama at MOT time. One carries a Korean badge and a warranty that used to be the industry's longest. The other carries a VW badge and the assumption, often unexamined, that German engineering means fewer problems. We pulled 5,935,528 MOT tests covering both models across their shared 2010-2020 production years to see which assumption actually holds up.
The result isn't close enough to call a tie, but it isn't a landslide either. Here's what the data shows, and what it means if you're choosing between the two on a used car forecourt right now.
The short version: The Hyundai i20 comes out ahead of the VW Polo across 5,935,528 combined MOT tests from 2010-2020, with a higher pass rate and fewer defects per test. The gap is real but modest. This is the i20 being consistently a bit more dependable, not the Polo being a bad car.
The Data Verdict
The Hyundai i20 is the more reliable car, by 49 points
Like-for-like comparison across the years both cars were on sale (2010-2020), from 5,935,528 real DVSA MOT tests. Scores out of 1000, higher is better.
Head-to-Head: The Numbers (2010-2020)
| Metric | Hyundai i20 | VW Polo |
|---|---|---|
| Reliability score (/1000) | 527 | 477 |
| MOT pass rate | 81.0% | 79.3% |
| First MOT pass rate (age 3) | 88.8% | 85.8% |
| Average defects per test | 1.59 | 1.69 |
| Typical annual mileage | 5,600 mi | 6,140 mi |
| MOT tests analysed | 1,234,452 | 4,701,076 |
| Vehicles tracked | 121,480 | 462,541 |
Pass Rate and Score, Year by Year
| Year | Hyundai i20 pass (score) | VW Polo pass (score) | Stronger |
|---|---|---|---|
| 2010 | 77.0% (536) | 74.5% (472) | Hyundai i20 |
| 2011 | 77.2% (514) | 74.9% (449) | Hyundai i20 |
| 2012 | 76.4% (445) | 76.7% (472) | VW Polo |
| 2013 | 77.4% (440) | 77.4% (459) | VW Polo |
| 2014 | 81.4% (519) | 79.3% (471) | Hyundai i20 |
| 2015 | 85.8% (619) | 82.6% (525) | Hyundai i20 |
| 2016 | 86.7% (607) | 84.1% (531) | Hyundai i20 |
| 2017 | 87.5% (566) | 84.9% (481) | Hyundai i20 |
| 2018 | 88.6% (567) | 84.6% (447) | Hyundai i20 |
| 2019 | 90.0% (575) | 86.0% (457) | Hyundai i20 |
| 2020 | 90.7% (565) | 88.9% (517) | Hyundai i20 |
Shared years only. Hyundai i20 data also covers 2021; VW Polo data also covers 2021-2023, covered in the full year-by-year guides below.
What Actually Fails on Each
Recorded defects and advisories per 100 MOT tests by DVSA inspection category, 2010-2020. A test can record more than one defect.
Hyundai i20
- Tyres, wheels and suspension: 53.3 per 100 tests typically around 49,500 miles
- Brakes: 40.3 per 100 tests typically around 51,500 miles
- Lights and electrics: 18.7 per 100 tests typically around 52,500 miles
- Visibility (wipers, washers, windscreen): 12.5 per 100 tests typically around 51,500 miles
- Other: 10.0 per 100 tests typically around 49,500 miles
VW Polo
- Tyres, wheels and suspension: 65.3 per 100 tests typically around 52,000 miles
- Brakes: 31.8 per 100 tests typically around 51,500 miles
- Lights and electrics: 17.3 per 100 tests typically around 56,500 miles
- Other: 13.6 per 100 tests typically around 53,500 miles
- Visibility (wipers, washers, windscreen): 9.9 per 100 tests typically around 53,000 miles
The Best Year to Buy Each
Reliability scores are age-adjusted: each year is judged against other cars of the same age. So when an older year out-scores a newer one, it means it holds up unusually well for its age, not that it will need less work than a much newer car. How our scores work.
Why Does the Hyundai i20 Come Out Ahead?
The i20 wins on pass rate and on defects per test, and the pattern behind those numbers tells you something. Hyundai owners in this dataset cover noticeably fewer miles a year than Polo owners. That's not a coincidence, it's a big part of the story. A car doing gentler annual mileage accumulates wear more slowly, and wear is what fails MOTs. The Polo's slightly higher annual mileage means the average example in this sample is simply being worked harder.
The other factor is consistency. Look at the year-by-year figures and the i20 tracks a steadier upward curve as the model ages through its production run. The Polo's scores bounce around more, dipping in a few years before recovering. A car that degrades predictably is easier to buy with confidence than one where the outcome depends heavily on which exact model year you land on.
None of this makes the Polo unreliable in absolute terms. Its pass rate still sits solidly within what you'd expect from a mainstream supermini, and DVSA MOT records show both cars comfortably ahead of the industry's worst performers. The i20 is the more dependable choice, but the Polo isn't a car to be scared of.
What Do the Defect Patterns Tell You?
Both cars fail MOTs for the same basic reason: tyres, wheels and suspension. That's true of almost every supermini on UK roads, and it mostly reflects how these cars are used (short urban trips, kerbed alloys, potholes) rather than any inherent design flaw. But the scale of the gap here is worth noting. The Polo's rate of chassis-related defects is meaningfully higher than the i20's, while the i20 shows a higher brake defect rate than the Polo.
Read together, this suggests the Polo's suspension and steering components take more of a battering over time, plausibly linked again to the higher mileage those cars tend to rack up, while the i20's brake wear pattern is the more common weak point to budget for. Neither is a dealbreaker. Both are wear items any used buyer should check regardless of make: tyre condition, uneven wear suggesting tracking issues, and brake disc/pad life at the point of purchase.
Electrics run close between the two, so don't expect one to be dramatically more finicky with warning lights than the other. If anything, the data suggests the differences between these cars are mechanical and mileage-driven rather than electronic. That's reassuring either way.
Which Years Should You Avoid on Each Model?
Age-adjusted scoring changes the picture from what a simple pass-rate table would suggest. For the i20, the early-to-mid production years score noticeably lower once you account for the fact that older cars are naturally compared against a tougher benchmark, and a couple of those years sit well below where you'd expect. The car improves sharply from the mid-2010s onward, and the standout year holds up unusually well for its age relative to the vehicles around it. That doesn't mean it needs any less maintenance than a genuinely newer car, though.
The Polo tells a similar story with its own wrinkles: a few years land clearly below the pack even after adjusting for age, and buyers should treat those as ones to inspect harder rather than avoid outright, since a bad score is a statistical pattern, not a guarantee of an individual car's condition. As with the i20, the newest years in this shared window score best, and if you can stretch to an even newer Polo outside this window, the data suggests it's worth the extra spend.
We've broken both of these down in full detail, year by year, with the reasoning behind each score. See our full Hyundai i20 year-by-year breakdown and our full VW Polo year-by-year breakdown before you commit to a specific plate.
Which Car Suits Which Buyer?
If you're buying on reliability data alone, the i20 is the safer bet, and its long warranty (seven years when new from Hyundai, though this varies by age and transferability on used examples) adds a layer of protection the Polo never offered from new. For a buyer prioritising low running risk and a car that's likely to sail through its MOT with minimal fuss, the i20 is the more rational choice. Its lower typical annual mileage in this dataset suggests it also tends to attract gentler, lower-intensity ownership.
The Polo still has a case. Its cabin quality, resale value and badge appeal on the used market are generally stronger, according to What Car? owner satisfaction data, and for buyers who value that German-badge solidity and don't mind slightly more attention to suspension components, it remains a perfectly sound choice. It's also worth checking Auto Trader listings, since Polo values tend to hold up well, which matters if you plan to sell on in a few years.
As a first car for a new driver, the i20's lower defect rate and gentler typical mileage make it the pragmatic pick, especially paired with cheaper parts and servicing that tend to come with the Korean badge. Whichever you choose, always run a check through gov.uk's MOT history tool on the specific car in front of you. Individual history beats model averages every time.
Frequently Asked Questions
Is the Hyundai i20 more reliable than the VW Polo?
Yes. Across 5,935,528 combined MOT tests from 2010-2020, the i20 posts a higher pass rate and fewer defects per test than the Polo, a gap of 1.7 percentage points on pass rate and 49 points on our reliability score.
Which Hyundai i20 years should you avoid?
The early-to-mid production years score lowest once adjusted for age, meaning they underperform relative to what you'd expect from a car of that age. Later years in the range improve sharply. See our full i20 year-by-year breakdown for specifics.
Which VW Polo years should you avoid?
A handful of years score clearly below the Polo's own average even after age-adjustment, and are worth extra inspection before buying. The newest years in the shared window, and especially newer plates outside it, score best. See our full Polo year-by-year breakdown for the detail.
Which is cheaper to run, the i20 or the Polo?
Our MOT data doesn't cover insurance or servicing costs directly, but the i20's lower defect rate per test suggests fewer unexpected repair bills on average, and Hyundai parts and labour are typically cheaper than VW's. Check quotes on your specific model and postcode via the RAC or a comparison site before deciding.
Which is better as a first car?
The i20 edges it for a first-time buyer: lower defect rates, gentler typical mileage patterns among existing owners, and cheaper running costs generally make it the lower-risk choice, though a well-maintained Polo is far from a bad option.
Our Verdict
A reliable model is only half the story. The exact Hyundai i20 or VW Polo you are looking at could be clocked, on outstanding finance, or a past write-off. Check the specific car before you commit.
Model averages tell you what to expect in general. They don't tell you about the specific i20 or Polo sitting on a forecourt with your name on it. Before you hand over a deposit, run its plate through PlateInsight. You get 5 free credits to check full MOT history, mileage patterns and past defects on any car you're considering.
You might also like
Check Any Vehicle's Full History
MOT results, mileage timeline, AI health score, and market valuations. New users get 5 free credits.