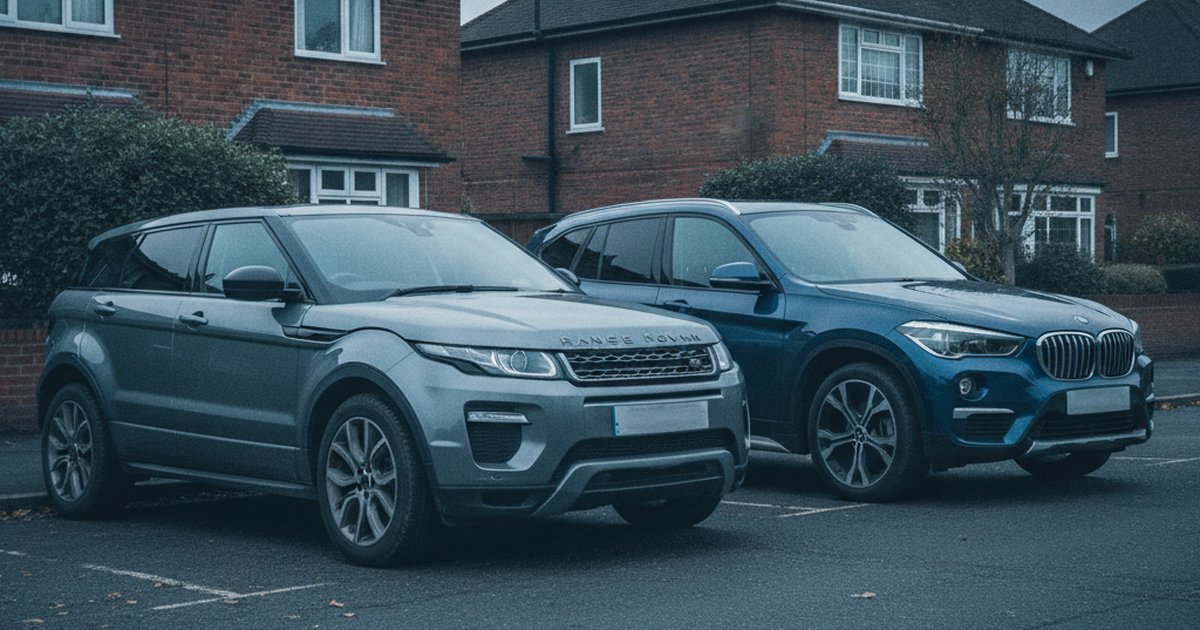
The Evoque and the X1 have been cross-shopped since the day both launched: same money, same premium badge appeal, same compact SUV footprint, and very different reputations. The Evoque carries Land Rover's baggage around electrical gremlins and dealer bills. The X1 carries BMW's reputation for tight engineering and mixed feelings about run-flat tyres. We pulled 1,972,229 MOT tests across both models, matched to the same 2011-2019 production years, to see whether either reputation actually holds up in the data.
It mostly doesn't. This is one of the closer calls we've run through PlateInsight's database, and the numbers explain why so many buyers end up choosing on badge preference and dealer relationship rather than any hard reliability edge.
The short version: The Evoque and X1 finish level on our reliability scoring across 1,972,229 shared MOT tests, both scoring 643/1000 with near-identical pass rates and annual mileage. The real differences show up in the defect data: the X1 racks up more tyre and suspension issues but far fewer brake failures, while the Evoque spreads its problems more evenly. Neither car should be bought on reliability reputation alone.
The Data Verdict
Too close to call: a single point between them across 1,972,229 MOT tests
Like-for-like comparison across the years both cars were on sale (2011-2019), from 1,972,229 real DVSA MOT tests. Scores out of 1000, higher is better.
Head-to-Head: The Numbers (2011-2019)
| Metric | Range Rover Evoque | BMW X1 |
|---|---|---|
| Reliability score (/1000) | 643 | 643 |
| MOT pass rate | 85.4% | 86.0% |
| First MOT pass rate (age 3) | 87.2% | 88.6% |
| Average defects per test | 1.28 | 1.21 |
| Typical annual mileage | 7,318 mi | 7,341 mi |
| MOT tests analysed | 1,230,534 | 741,695 |
| Vehicles tracked | 139,143 | 89,239 |
Pass Rate and Score, Year by Year
| Year | Range Rover Evoque pass (score) | BMW X1 pass (score) | Stronger |
|---|---|---|---|
| 2011 | 82.8% (707) | 82.1% (679) | Range Rover Evoque |
| 2012 | 82.2% (669) | 82.3% (655) | Range Rover Evoque |
| 2013 | 82.8% (643) | 83.4% (646) | Even |
| 2014 | 84.2% (635) | 83.3% (599) | Range Rover Evoque |
| 2015 | 85.6% (626) | 86.0% (633) | Even |
| 2016 | 87.9% (654) | 88.7% (680) | BMW X1 |
| 2017 | 88.5% (625) | 89.1% (645) | BMW X1 |
| 2018 | 88.7% (612) | 89.1% (613) | Even |
| 2019 | 88.7% (600) | 90.4% (616) | BMW X1 |
Shared years only. Range Rover Evoque data also covers 2020; BMW X1 data also covers 2010, 2020-2022, covered in the full year-by-year guides below.
What Actually Fails on Each
Recorded defects and advisories per 100 MOT tests by DVSA inspection category, 2011-2019. A test can record more than one defect.
Range Rover Evoque
- Tyres, wheels and suspension: 47.8 per 100 tests typically around 59,000 miles
- Brakes: 35.6 per 100 tests typically around 57,000 miles
- Other: 10.8 per 100 tests typically around 60,000 miles
- Lights and electrics: 8.2 per 100 tests typically around 63,500 miles
- Visibility (wipers, washers, windscreen): 7.6 per 100 tests typically around 64,000 miles
BMW X1
- Tyres, wheels and suspension: 55.6 per 100 tests typically around 56,000 miles
- Brakes: 21.5 per 100 tests typically around 59,000 miles
- Other: 11.2 per 100 tests typically around 57,000 miles
- Lights and electrics: 9.1 per 100 tests typically around 62,500 miles
- Visibility (wipers, washers, windscreen): 7.0 per 100 tests typically around 59,000 miles
The Best Year to Buy Each
Reliability scores are age-adjusted: each year is judged against other cars of the same age. So when an older year out-scores a newer one, it means it holds up unusually well for its age, not that it will need less work than a much newer car. How our scores work.
Why Do the Evoque and X1 Score the Same for Reliability?
A dead-even score across nearly two million tests isn't a coincidence. It's a sign that these two cars are used the same way by the same type of owner. Annual mileage is almost identical between them, both sitting in the low 7,000s, which tells you these are second cars or gentle-use family SUVs rather than daily motorway workhorses. That matters because mileage is one of the biggest drivers of MOT failure rates, and when two models are driven the same modest distances each year, a lot of the gap you'd expect from mechanical differences gets flattened out.
First MOT pass rates back this up. Both cars pass their initial test at broadly similar rates, and both then follow the same pattern of pass rates climbing as the fleet ages and weaker examples get scrapped or sold on. Neither model shows the kind of early-life failure spike that would flag a genuinely troublesome generation. If you were expecting the Evoque to fall apart faster than the X1, or the X1 to sail through untouched, the data doesn't support either story.
What Do the Defect Categories Actually Tell You?
This is where the two cars diverge, even though the overall scores don't. The X1 picks up meaningfully more tyre, wheel and suspension defects than the Evoque, which lines up with what you'd expect from a car that's often specced with run-flat tyres and firmer, sportier suspension setups that punish potholes and poor road surfaces. If you're buying an X1, budget for tyres and suspension bushes wearing faster than you might assume from a BMW badge.
The Evoque tells a different story. Its brake defect rate is considerably higher than the X1's, nearly double the rate per 100 tests, which matters more in practice because brakes are safety-critical and expensive to sort properly on a 4x4 platform with larger discs and calipers. The Evoque also spreads its issues more broadly across lights, electrics and visibility categories, which fits the wider narrative around Land Rover's electrical systems. Nothing here suggests a car falling apart though, just a higher baseline of small niggling faults.
Key point: Neither car has a standout dangerous defect problem in this data, so the differences here are about running costs and annoyance, not safety.
Which Years Should You Buy or Avoid?
Both cars follow a familiar pattern: their earliest model years score unusually well for their age, better than several newer years in the same window, which is a strong sign of survivorship. The Evoques and X1s still on the road from 2011 are the ones that were looked after well enough to last, while weaker examples have already been scrapped. That's a value opportunity if you understand the trade-off, but it's not a signal that a 2011 car needs less maintenance than a 2018 one. Older is still older.
For the Evoque, pass rates climb steadily from the early 2010s through to 2018-2019, even as the age-adjusted score gradually drops, which is normal as a model line matures and gets refined. The BMW X1 shows a similar pattern, with pass rates improving nicely into 2018-2019 despite fluctuating scores year to year. For the full year-by-year picture, including which specific model years to steer clear of, read our full Range Rover Evoque year-by-year breakdown and our full BMW X1 year-by-year breakdown before you commit to a specific age bracket.
As a rule of thumb: if you want the newest car with the strongest recent pass rate, look at 2018-2019 examples of either model. If you want a cheaper, older example and are comfortable with the extra wear that comes with age, the early-2010s cars for both brands have proven themselves through natural selection on UK roads, according to DVSA MOT history data.
Which Car Suits Which Kind of Buyer?
Given the tie, this comes down to how you actually plan to use the car and what kind of faults you'd rather deal with. If you do a lot of rural or poorly surfaced road driving, the Evoque's lower tyre and suspension defect rate is worth something in real terms: fewer trips to the tyre shop and less money spent on alignment and bushes. If your annual mileage leans more urban and you're comfortable with tyre wear as a running cost, the X1's lower brake defect rate and BMW's reputation for parts availability (RAC and AA breakdown call-out data consistently show German brands with strong dealer network coverage) might tip things your way.
Buyers chasing cabin quality and off-road capability, even if rarely used, tend to lean Evoque. Buyers who want sharper handling and a badge that holds resale value slightly better in the used market, per Auto Trader listings data, tend to lean X1. Neither choice is wrong on reliability grounds, because the numbers simply don't separate them.
Frequently Asked Questions
Is the Range Rover Evoque more reliable than the BMW X1?
No, not according to the MOT data. Both score 643/1000 across 1,972,229 shared tests from 2011-2019, with pass rates within a fraction of a percent of each other. This is a genuine tie.
Which Range Rover Evoque years should you avoid?
The Evoque's age-adjusted score declines fairly steadily from 2011 through to 2019, with 2018 and 2019 posting the lowest scores despite higher raw pass rates. See our full year-by-year Evoque breakdown for specifics on which model years to prioritise or skip.
Which BMW X1 years should you avoid?
The X1's scores dip notably in 2014, its weakest year in the shared window, before recovering in 2016. Check our full BMW X1 year-by-year breakdown for the complete picture before buying a specific age.
Does one of these cars cost more to run day to day?
The data suggests different cost profiles rather than one being cheaper overall. The X1 shows a higher tyre and suspension defect rate, meaning more spend there, while the Evoque shows nearly double the brake defect rate, which tends to be pricier to fix given its larger discs and calipers.
Which is better as a first premium SUV?
Either works, given the tied reliability data. First-time premium SUV buyers who want simpler running costs might lean toward the Evoque for its lower tyre wear, while those wanting sharper dynamics and stronger dealer network coverage might prefer the X1.
Our Verdict
A reliable model is only half the story. The exact Range Rover Evoque or BMW X1 you are looking at could be clocked, on outstanding finance, or a past write-off. Check the specific car before you commit.
When two cars land dead level on reliability, the sensible move is to stop asking 'which is more reliable' and start checking the actual history of the specific car in front of you. A well-maintained Evoque will beat a neglected X1 every time, and vice versa. Run any Evoque or X1 you're considering through PlateInsight before you hand over a deposit. You get 5 free credits to check full MOT history, mileage patterns and past defects on the exact vehicle, not just the model average.
You might also like
Check Any Vehicle's Full History
MOT results, mileage timeline, AI health score, and market valuations. New users get 5 free credits.