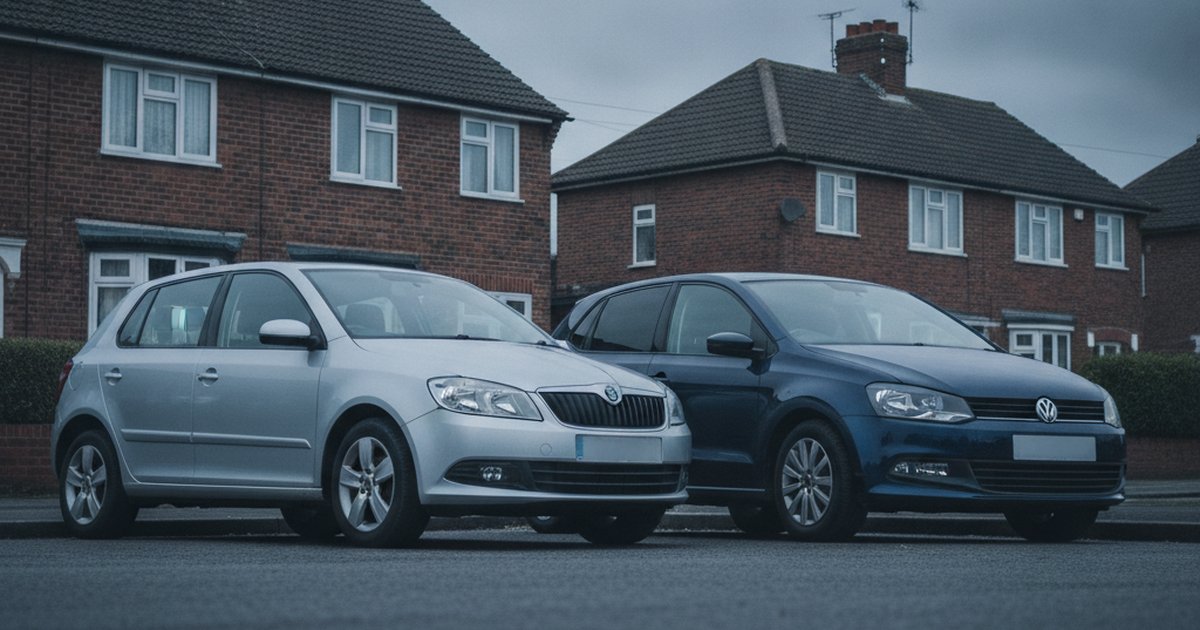
The Fabia and Polo share a platform, share an engine range, and for a decade shared a lot of the same suppliers. One wears a Skoda badge and usually costs less to buy. The other wears the VW roundel and trades on that badge at resale. We've pulled 6,431,047 MOT tests covering both cars across their shared production years (2010-2021) to answer the question every budget-conscious buyer asks: does the cheaper badge actually get you the same car underneath, reliability included?
Short answer: not quite. The data shows a real gap, and it isn't the direction some badge snobs might expect.
The short version: Across 6,431,047 combined MOT tests, the Skoda Fabia beats the VW Polo by 85 points and a 3.2 percentage point higher pass rate. Both cars share mechanicals, but the Fabia picks up fewer defects per test and fails less often, despite near-identical annual mileage. If you're choosing on reliability data alone, the Fabia wins.
The Data Verdict
The Skoda Fabia is the more reliable car, by 85 points
Like-for-like comparison across the years both cars were on sale (2010-2021), from 6,431,047 real DVSA MOT tests. Scores out of 1000, higher is better.
Head-to-Head: The Numbers (2010-2021)
| Metric | Skoda Fabia | VW Polo |
|---|---|---|
| Reliability score (/1000) | 563 | 477 |
| MOT pass rate | 82.5% | 79.3% |
| First MOT pass rate (age 3) | 86.7% | 85.8% |
| Average defects per test | 1.51 | 1.69 |
| Typical annual mileage | 6,161 mi | 6,141 mi |
| MOT tests analysed | 1,715,409 | 4,715,638 |
| Vehicles tracked | 183,834 | 468,726 |
Pass Rate and Score, Year by Year
| Year | Skoda Fabia pass (score) | VW Polo pass (score) | Stronger |
|---|---|---|---|
| 2010 | 78.4% (581) | 74.5% (472) | Skoda Fabia |
| 2011 | 79.6% (595) | 74.9% (449) | Skoda Fabia |
| 2012 | 80.5% (593) | 76.7% (472) | Skoda Fabia |
| 2013 | 82.1% (601) | 77.4% (459) | Skoda Fabia |
| 2014 | 83.1% (582) | 79.3% (471) | Skoda Fabia |
| 2015 | 84.7% (581) | 82.6% (525) | Skoda Fabia |
| 2016 | 84.4% (542) | 84.1% (531) | Skoda Fabia |
| 2017 | 85.1% (494) | 84.9% (481) | Skoda Fabia |
| 2018 | 85.2% (460) | 84.6% (447) | Skoda Fabia |
| 2019 | 87.4% (496) | 86.0% (457) | Skoda Fabia |
| 2020 | 87.8% (477) | 88.9% (517) | VW Polo |
| 2021 | 87.4% (447) | 89.5% (512) | VW Polo |
Shared years only. Skoda Fabia data also covers 2022; VW Polo data also covers 2022-2023, covered in the full year-by-year guides below.
What Actually Fails on Each
Recorded defects and advisories per 100 MOT tests by DVSA inspection category, 2010-2021. A test can record more than one defect.
Skoda Fabia
- Tyres, wheels and suspension: 60.9 per 100 tests typically around 50,500 miles
- Brakes: 28.1 per 100 tests typically around 52,500 miles
- Lights and electrics: 13.9 per 100 tests typically around 58,500 miles
- Other: 12.5 per 100 tests typically around 54,500 miles
- Visibility (wipers, washers, windscreen): 8.2 per 100 tests typically around 54,500 miles
VW Polo
- Tyres, wheels and suspension: 65.2 per 100 tests typically around 52,000 miles
- Brakes: 31.7 per 100 tests typically around 51,500 miles
- Lights and electrics: 17.2 per 100 tests typically around 56,500 miles
- Other: 13.6 per 100 tests typically around 53,500 miles
- Visibility (wipers, washers, windscreen): 9.9 per 100 tests typically around 53,000 miles
The Best Year to Buy Each
Reliability scores are age-adjusted: each year is judged against other cars of the same age. So when an older year out-scores a newer one, it means it holds up unusually well for its age, not that it will need less work than a much newer car. How our scores work.
Why Does the Fabia Beat the Polo on Reliability?
These two cars run the same PQ25/MQB-derived platforms, the same 1.0, 1.2 and 1.4-litre petrol engines, and often the same gearboxes, depending on generation. So a 3.2 point pass rate gap and a lower defects-per-test figure for the Fabia isn't down to different engineering. It's down to what happens after the cars leave the factory.
Annual mileage is almost identical between the two (6,161 miles a year for the Fabia versus 6,141 for the Polo), which rules out the usual excuse that one model just gets driven harder. What's left is trim mix, options fitted, and to some extent buyer profile. Fabias have historically sold with fewer of the trim-level extras and heavier alloy/tyre packages that tend to generate wheel and suspension complaints, and Skoda's UK ownership base skews toward buyers who keep cars longer and service them on schedule rather than lease-and-swap. The Polo, as the more image-conscious badge, has pulled in a wider spread of ownership styles, some of which show up in the MOT bay as more frequent lights, electrics and steering defects.
The first-MOT figures are close (86.7% Fabia, 85.8% Polo), which tells you the cars leave the showroom in similar shape. The gap opens up over time, which points to wear and maintenance patterns rather than a factory quality difference.
What Do the Defect Patterns Actually Tell You?
Both cars fail MOTs for the same reasons in the same order: tyres and suspension first, brakes second, lights and electrics third. That consistency across 6.4 million tests confirms these are genuinely shared mechanical platforms wearing out in genuinely shared ways.
The difference is in scale. The Polo racks up higher defect rates in every category we tracked, tyres and suspension, brakes, lights, visibility items, and it's the only one of the two with steering defects significant enough to register as a top category. None of these are catastrophic or unusual for a supermini at this mileage bracket, but they add up. A Polo owner is statistically more likely to be told about an advisory or a fail item at each visit than a Fabia owner of the same age.
Key point: Neither car shows an alarming dangerous defect rate in this data, so this isn't a safety story. It's a running-cost and hassle story: more defects per test means more trips back to the garage and more bills, even if none of them are serious on their own.
Which Years Should You Buy or Avoid?
Both cars follow a similar arc: pass rates climb steadily through the 2010s as facelifts and running changes bed in, then wobble slightly in specific years before the newest examples (helped by low age and low mileage) post the strongest scores.
For the Fabia, the mid-2010s cars hold their own well for their age, and the 2016-2018 period shows a dip in score even as raw pass rate keeps climbing. That's a sign testers were logging more advisories on cars from that batch even though most still passed. For the full year-by-year detail, including which specific model years to steer clear of, see our full Skoda Fabia year-by-year breakdown.
The Polo tells a similar story with an even steeper dip in 2018, where the score drops noticeably despite a respectable pass rate, again pointing to more advisories being flagged rather than outright failures. Earlier Polos from 2010-2013 are the weakest of the bunch on both pass rate and score, a mix of age and higher mileage rather than any single fault. The full breakdown, including years that outperform their age bracket, is in our full VW Polo year-by-year breakdown.
In both cases, treat older strong-scoring years as value buys rather than proof of low maintenance needs. A car that scores well for its age still has that age working against it. Tyres, brakes and suspension bushings don't care what year the MOT database says is a good one.
Which Car Suits Which Buyer?
If reliability data is your main decision criterion, the Fabia is the more sensible buy. It costs less to buy, holds a smaller badge premium, and the MOT record backs it up rather than punishing you for it. For a first car, a family runabout, or anyone who wants to spend as little as possible on both purchase price and follow-up garage bills, the Fabia is the stronger case. Gov.uk's own MOT history checker is worth running on any specific example before you commit either way.
The Polo still has a case. It generally holds resale value better thanks to the VW badge, and later examples with the shorter shift automatic and newer engines address some of the higher-mileage wear-related complaints. If you value badge and interior finish over squeezing out every last pound of value, and you're buying a newer, lower-mileage Polo rather than an early one, the reliability gap narrows enough to make it a defensible choice. Just go in accepting you're paying VW money for Skoda-plus-a-bit-worse reliability, according to this dataset.
Frequently Asked Questions
Is the Skoda Fabia more reliable than the VW Polo?
Yes. Across 6,431,047 MOT tests in their shared production years (2010-2021), the Fabia scores 85 points higher and has a 3.2 percentage point better pass rate than the Polo, despite sharing platforms and engines.
Which Skoda Fabia years should you avoid?
The mid-to-late 2010s Fabias show more advisories being logged even as pass rates hold up, particularly around 2016-2018. See our full Fabia year-by-year breakdown for specific years to prioritise or avoid.
Which VW Polo years should you avoid?
Early Polos from 2010-2013 post the weakest combination of pass rate and score in this dataset, and 2018 shows a notable dip in score despite a decent pass rate. Check our full Polo year-by-year breakdown before buying an example from these years.
Does the reliability difference affect insurance or running costs?
The data doesn't cover insurance directly, but a higher defects-per-test rate on the Polo suggests more frequent garage bills for brakes, tyres and suspension work over ownership, even though neither car shows a concerning rate of dangerous defects.
Which is better as a first car, the Fabia or the Polo?
The Fabia is the stronger choice for a first car on this data: cheaper to buy, fewer MOT defects on average, and a higher pass rate, which should mean fewer surprise bills for a new driver on a budget.
Our Verdict
A reliable model is only half the story. The exact Skoda Fabia or VW Polo you are looking at could be clocked, on outstanding finance, or a past write-off. Check the specific car before you commit.
Both cars are fundamentally the same engineering underneath a different badge, but the MOT record shows real daylight between them. Before you buy either, run the specific vehicle's history through PlateInsight. You get 5 free credits to check full MOT and mileage records, so you're not relying on averages when it's your money on the table.
You might also like
Check Any Vehicle's Full History
MOT results, mileage timeline, AI health score, and market valuations. New users get 5 free credits.