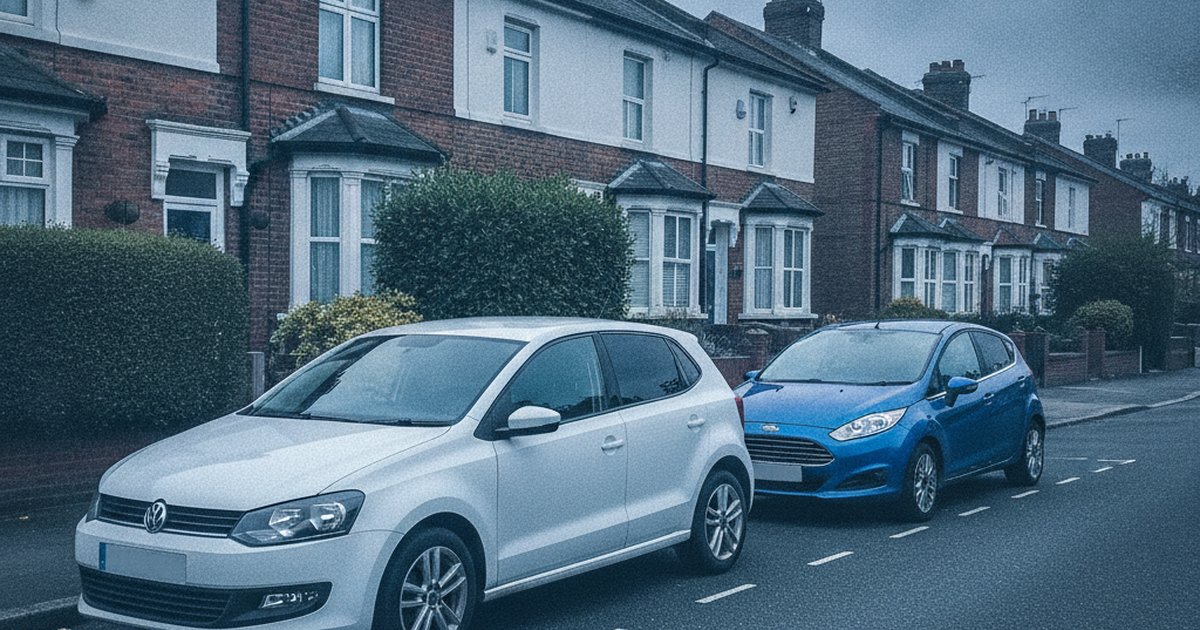
The Polo and Fiesta have spent three decades fighting over the same driveways, the same first-time buyers, and the same secondhand forecourts. The Polo is supposedly the sensible one: solidly screwed together, a bit dull, built to last. The Fiesta is supposedly the fun one: sharper to drive, cheaper to buy, but less durable underneath. We pulled 16,265,436 MOT tests covering both models across shared build years 2010 to 2022 to see whether either reputation holds up in the test lane.
It barely does. The two cars finish within 10 points of each other on our reliability scoring, close enough that we're calling it a genuine tie rather than pretending one is meaningfully more dependable. What's more interesting is how each car gets to a similar result, because the routes are quite different.
The short version: The Polo and Fiesta are statistically level on reliability, separated by just 10 points across 16.2 million MOT tests. The Fiesta throws up more suspension and steering trouble per test, while the Polo picks up more electrical faults. Both cars are driven at almost identical annual mileages, so this isn't a case of one being thrashed harder than the other. It comes down to what kind of fault annoys you least.
The Data Verdict
Too close to call: 10 points between them across 16,265,436 MOT tests
Like-for-like comparison across the years both cars were on sale (2010-2022), from 16,265,436 real DVSA MOT tests. Scores out of 1000, higher is better.
Head-to-Head: The Numbers (2010-2022)
| Metric | VW Polo | Ford Fiesta |
|---|---|---|
| Reliability score (/1000) | 478 | 468 |
| MOT pass rate | 79.4% | 78.7% |
| First MOT pass rate (age 3) | 85.8% | 86.4% |
| Average defects per test | 1.69 | 1.74 |
| Typical annual mileage | 6,142 mi | 6,144 mi |
| MOT tests analysed | 4,723,658 | 11,541,778 |
| Vehicles tracked | 475,330 | 1,101,648 |
Pass Rate and Score, Year by Year
| Year | VW Polo pass (score) | Ford Fiesta pass (score) | Stronger |
|---|---|---|---|
| 2010 | 74.5% (472) | 74.8% (491) | Ford Fiesta |
| 2011 | 74.9% (449) | 76.7% (511) | Ford Fiesta |
| 2012 | 76.7% (472) | 77.2% (490) | Ford Fiesta |
| 2013 | 77.4% (459) | 77.8% (477) | Ford Fiesta |
| 2014 | 79.3% (471) | 78.6% (454) | VW Polo |
| 2015 | 82.6% (525) | 78.9% (407) | VW Polo |
| 2016 | 84.1% (531) | 79.0% (369) | VW Polo |
| 2017 | 84.9% (481) | 84.4% (465) | VW Polo |
| 2018 | 84.6% (447) | 87.6% (542) | Ford Fiesta |
| 2019 | 86.0% (457) | 88.1% (522) | Ford Fiesta |
| 2020 | 88.9% (517) | 87.1% (468) | VW Polo |
| 2021 | 89.5% (512) | 89.4% (508) | Even |
| 2022 | 92.5% (580) | 91.2% (531) | VW Polo |
Shared years only. VW Polo data also covers 2023; Ford Fiesta data also covers 2023, covered in the full year-by-year guides below.
What Actually Fails on Each
Recorded defects and advisories per 100 MOT tests by DVSA inspection category, 2010-2022. A test can record more than one defect.
VW Polo
- Tyres, wheels and suspension: 65.2 per 100 tests typically around 52,000 miles
- Brakes: 31.7 per 100 tests typically around 51,500 miles
- Lights and electrics: 17.2 per 100 tests typically around 56,500 miles
- Other: 13.5 per 100 tests typically around 53,500 miles
- Visibility (wipers, washers, windscreen): 9.9 per 100 tests typically around 53,000 miles
Ford Fiesta
- Tyres, wheels and suspension: 77.4 per 100 tests typically around 54,500 miles
- Brakes: 23.5 per 100 tests typically around 54,500 miles
- Lights and electrics: 22.4 per 100 tests typically around 58,500 miles
- Other: 13.9 per 100 tests typically around 57,500 miles
- Visibility (wipers, washers, windscreen): 7.8 per 100 tests typically around 58,500 miles
The Best Year to Buy Each
Reliability scores are age-adjusted: each year is judged against other cars of the same age. So when an older year out-scores a newer one, it means it holds up unusually well for its age, not that it will need less work than a much newer car. How our scores work.
Why Do the Polo and Fiesta End Up So Close?
Both cars cover near-identical annual mileage, which strips out one of the usual excuses for a weaker score. Neither model is driven noticeably harder than the other, so the defect data reflects the cars themselves rather than different ownership patterns. That's unusual for a head-to-head like this and it's a big part of why the scores land so close together.
The Fiesta's first MOT pass rate is marginally higher than the Polo's, which tells you both cars leave the factory and the first three years in decent shape. The gap only opens slightly once the cars pass into the used market and get handed round more owners, and even then it never widens enough to call a clear winner. The gov.uk MOT history checker shows the same pattern if you spot-check individual examples: both cars age at a similar rate, they just age differently.
What Do the Defect Patterns Actually Tell You?
This is where the two cars separate, even if the overall scores don't. The Fiesta racks up a noticeably higher rate of tyre, wheel and suspension defects than the Polo. Some of that comes down to the Fiesta's sportier suspension tuning, the very thing that gives it the edge on a b-road. Stiffer setups and firmer bushes tend to wear and rattle loose faster than a softer, more compliant setup. If you've bought into the Fiesta's reputation as the driver's supermini, this is the trade-off that comes with it.
The Polo, by contrast, throws up more lights and electrics defects proportionally than its suspension and brake figures would suggest, and its brake defect rate per test is actually higher than the Fiesta's. Neither is a dealbreaker on its own, but a pre-purchase check on a Polo is worth spending extra time on brake components and wiring, while a Fiesta check should focus on suspension bushes, arms and steering components, especially on any car past 50,000 miles, which is roughly where these faults start clustering in the data.
Key point: the average defects per test are close (1.69 for the Polo, 1.74 for the Fiesta) but the type of defect differs enough to matter. Buy the Polo and budget for electrics and brakes; buy the Fiesta and budget for suspension and steering.
Which Years of Each Should You Avoid?
Neither car ages in a straight line. Both dip in the middle of their production run before recovering sharply in their newest model years, a familiar pattern as manufacturers iron out issues, tighten up build quality, or move to more mature engine and component supply. The Fiesta's dip is the more dramatic of the two, with its weakest scoring years landing mid-decade before a strong turnaround from 2017 onwards. The Polo's low point comes slightly earlier and its recovery is steadier rather than sudden.
If you're shopping on a budget and looking at mid-2010s cars from either model, go in with your eyes open. They're not disasters, but they're clearly the weaker vintages within each model's range. For the full picture, including which specific model years to avoid and which are quiet bargains, read our full VW Polo year-by-year breakdown and our full Ford Fiesta year-by-year breakdown before you commit to a specific plate.
Both cars' strongest years sit right at the newest end of the range we tested, and they hold up well even accounting for the fact that a newer car should naturally score better. It's a genuine result, not just an age effect, and it means a later example of either car is the safer buy if your budget stretches that far. Just remember these are still used cars with tens of thousands of miles on them. Strong scores for their age don't mean they're maintenance-free.
So Which One Should You Actually Buy?
Given the tie, this comes down to how you use the car and what kind of fault you'd rather deal with. If you want a car that feels planted and grown-up, and you're happy to keep an eye on brakes and electrics at service time, the Polo's reputation for solidity is fair, even if the MOT data says it's not meaningfully more reliable than its rival. If you want the sharper drive and don't mind a slightly higher chance of a suspension advisory around the 50,000-mile mark, the Fiesta earns its reputation as the more entertaining choice without paying a real reliability penalty for it.
Running costs and insurance will likely sway your decision as much as this data does. The Fiesta's larger UK fleet keeps parts cheap and widely available, something Auto Trader listings reflect in typically lower asking prices for like-for-like age and mileage. The Polo tends to hold its value a touch better, which cuts both ways depending on whether you're buying or eventually selling.
Frequently Asked Questions
Is the VW Polo more reliable than the Ford Fiesta?
Not meaningfully. Across 16,265,436 shared-age MOT tests the Polo scores 478 to the Fiesta's 468, a 10-point gap that's too small to call a real winner. Treat them as tied on reliability.
Which VW Polo years should you avoid?
The Polo's weakest scoring years fall in the early-to-mid 2010s before a steady recovery from 2015 onwards. See our full VW Polo year-by-year breakdown for exact figures on each model year.
Which Ford Fiesta years should you avoid?
The Fiesta dips hardest in the mid-2010s, with its lowest score landing around 2016, before a sharp recovery from 2017 onwards. Check our full Ford Fiesta year-by-year breakdown for the details.
Which is cheaper to insure and run, the Polo or the Fiesta?
The data here doesn't cover insurance directly, but the Fiesta's much larger UK fleet generally means cheaper parts and wider garage availability, while the Polo tends to hold its resale value slightly better.
Which is better as a first car?
Both are sensible first-car choices given their near-identical reliability. The Polo's slightly more relaxed driving character suits nervous new drivers, while the Fiesta's lower typical price and sharper handling appeal to those who want more engagement without a reliability trade-off.
Our Verdict
A reliable model is only half the story. The exact VW Polo or Ford Fiesta you are looking at could be clocked, on outstanding finance, or a past write-off. Check the specific car before you commit.
With the scores this close, the smartest move is to stop comparing badges and start checking the individual car in front of you. Run the specific reg through PlateInsight, look at its MOT history for the exact defect patterns we've flagged here (suspension on the Fiesta, brakes and electrics on the Polo), and let that decide it rather than the reputation of either nameplate. You get 5 free checks to start, so there's no reason to buy either car blind.
You might also like
Check Any Vehicle's Full History
MOT results, mileage timeline, AI health score, and market valuations. New users get 5 free credits.