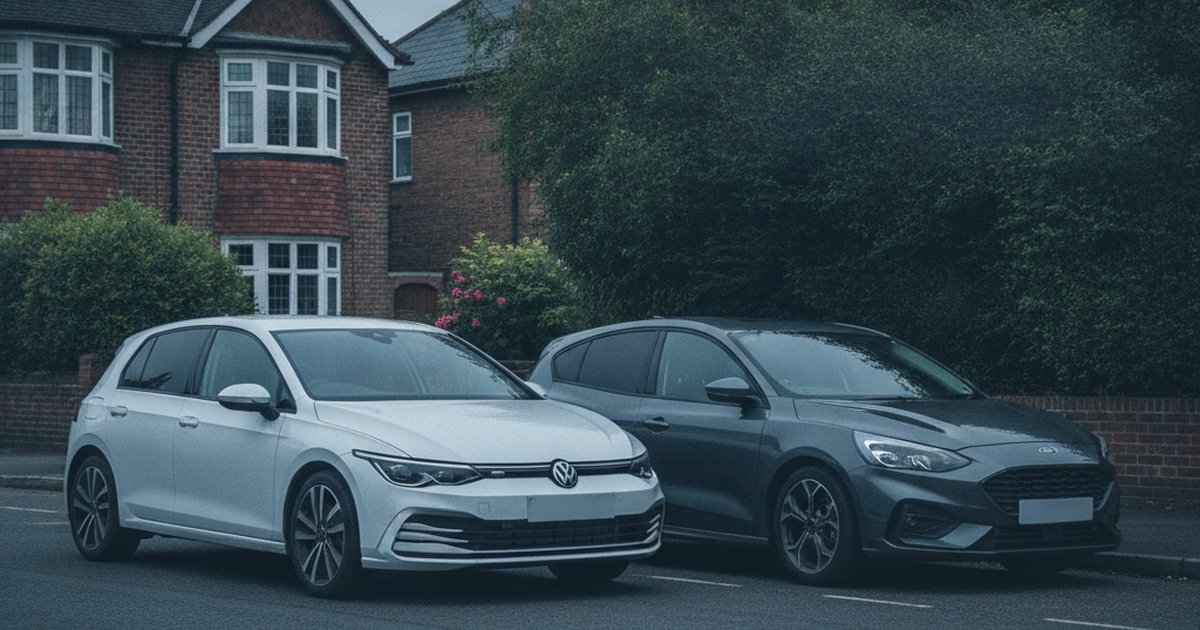
The Golf versus Focus argument has been running in pub car parks and dealer forecourts for two decades. One side reaches for the German badge and 'proper' interior. The other points at the way a Focus handles a roundabout and asks why you'd pay extra for the privilege of feeling less involved. We've stopped guessing and gone to the DVSA test records instead. Across 13,656,724 MOT tests on both models from 2010 to 2022, the data gives a clear answer, and it's not quite the one the badge snobs expect, at least not by the margin they'd like.
The short version: The VW Golf beats the Ford Focus by 99 points and a 3.6 percentage point higher pass rate across 13.6 million combined MOT tests from 2010-2022. Both cars fail MOTs for the same reason (tyres, wheels and suspension), but the Focus racks up noticeably more lights and electrics defects. The Golf's advantage isn't huge, but it holds up across almost every model year.
The Data Verdict
The VW Golf is the more reliable car, by 98 points
Like-for-like comparison across the years both cars were on sale (2010-2022), from 13,656,724 real DVSA MOT tests. Scores out of 1000, higher is better.
Head-to-Head: The Numbers (2010-2022)
| Metric | VW Golf | Ford Focus |
|---|---|---|
| Reliability score (/1000) | 649 | 550 |
| MOT pass rate | 83.7% | 80.1% |
| First MOT pass rate (age 3) | 85.5% | 87.6% |
| Average defects per test | 1.55 | 1.61 |
| Typical annual mileage | 7,691 mi | 7,312 mi |
| MOT tests analysed | 6,089,144 | 7,567,580 |
| Vehicles tracked | 647,536 | 744,890 |
Pass Rate and Score, Year by Year
| Year | VW Golf pass (score) | Ford Focus pass (score) | Stronger |
|---|---|---|---|
| 2010 | 78.2% (637) | 75.0% (529) | VW Golf |
| 2011 | 79.1% (624) | 76.5% (539) | VW Golf |
| 2012 | 80.9% (643) | 78.1% (554) | VW Golf |
| 2013 | 83.6% (685) | 77.9% (510) | VW Golf |
| 2014 | 85.1% (685) | 80.5% (543) | VW Golf |
| 2015 | 86.6% (676) | 84.2% (607) | VW Golf |
| 2016 | 87.5% (658) | 85.5% (602) | VW Golf |
| 2017 | 88.3% (626) | 87.4% (593) | VW Golf |
| 2018 | 88.4% (602) | 87.2% (556) | VW Golf |
| 2019 | 89.9% (623) | 86.5% (512) | VW Golf |
| 2020 | 91.7% (631) | 88.4% (551) | VW Golf |
| 2022 | 93.4% (625) | 90.8% (574) | VW Golf |
Shared years only. VW Golf data also covers 2021, 2023; Ford Focus data also covers 2021, 2023, covered in the full year-by-year guides below.
What Actually Fails on Each
Recorded defects and advisories per 100 MOT tests by DVSA inspection category, 2010-2022. A test can record more than one defect.
VW Golf
- Tyres, wheels and suspension: 72.4 per 100 tests typically around 67,500 miles
- Brakes: 26.8 per 100 tests typically around 68,000 miles
- Other: 11.8 per 100 tests typically around 69,500 miles
- Lights and electrics: 11.5 per 100 tests typically around 75,000 miles
- Visibility (wipers, washers, windscreen): 9.0 per 100 tests typically around 70,500 miles
Ford Focus
- Tyres, wheels and suspension: 65.8 per 100 tests typically around 66,000 miles
- Brakes: 24.3 per 100 tests typically around 65,500 miles
- Lights and electrics: 22.2 per 100 tests typically around 70,500 miles
- Other: 14.1 per 100 tests typically around 66,000 miles
- Visibility (wipers, washers, windscreen): 8.3 per 100 tests typically around 69,500 miles
The Best Year to Buy Each
Reliability scores are age-adjusted: each year is judged against other cars of the same age. So when an older year out-scores a newer one, it means it holds up unusually well for its age, not that it will need less work than a much newer car. How our scores work.
Why Does the Golf Win?
A 99-point gap sounds decisive until you look at what's behind it. The Golf isn't dramatically better in any one area; it's quietly better almost everywhere. Look at the year-by-year figures and the Golf outscores or matches the Focus in nearly every shared model year, not just in one standout generation. That points to a car built with slightly tighter tolerances and a more conservative approach to component durability, rather than one lucky engine range dragging the average up.
Ownership habits play a part too. Golf owners in this dataset cover marginally fewer annual miles than Focus owners. It's not a huge gap, but lower mileage cars generally show fewer wear-related defects by the time they reach an MOT bay, and that shows up in the aggregate pass rate. It doesn't explain everything, though: the Golf's advantage holds even once you account for how close the two cars' usage patterns actually are, which suggests a genuine build quality edge rather than just gentler driving.
Here's the twist: the Focus actually has a higher first MOT pass rate than the Golf. New Focuses are put together well and pass their initial test in higher numbers. The Golf's advantage builds as the cars age, which tells you this is a durability story more than a factory quality one. The Focus starts strong and fades a bit faster; the Golf starts slightly behind and then holds its line.
What Do the Defect Patterns Actually Tell You?
Both cars fail MOTs for the same basic reason: tyres, wheels and suspension dominate the defect sheet for both, which is normal for family hatchbacks doing typical UK mileage on typical UK roads. Neither car should worry you here. This is wear-and-tear territory, not design flaw territory, and any used example of either will need attention in this area eventually.
The more revealing gap is in lights and electrics. Focus owners report noticeably more issues in this category than Golf owners. It won't fail an MOT outright in most cases, but it's the kind of thing that turns into an annoying bulb, sensor or wiring fault that costs you a Saturday morning and a trip to the parts counter. If you've owned a Focus and grumbled about a recurring dashboard warning light or a fussy indicator relay, the data backs you up. It's a genuine pattern across the model, not just bad luck with one car.
Brakes and 'other' defects are broadly similar between the two, so don't let either camp claim a decisive win there. The overall defects-per-test figures for both cars sit close enough that neither one is dramatically more fiddly to live with day to day. The difference that matters is in pass rate, not in how many small things go wrong along the way.
Which Years Should You Buy or Avoid?
Neither car ages in a straight line, and picking the right year matters more than picking the right badge. For the Golf, the strongest age-adjusted year in this window holds up unusually well for its age, though a newer example will still need less imminent attention purely by being younger. For the Focus, the standout year sits later in the run, reflecting a facelift-era car that had some of the early electrics gremlins ironed out.
Early 2010-2013 examples of both cars show noticeably lower pass rates than anything from 2015 onwards, so treat pre-2014 cars of either badge with more caution regardless of which one you're leaning towards. If you want the full picture on specific years to avoid and why, we've broken down every model year in detail in our full VW Golf year-by-year breakdown and our full Ford Focus year-by-year breakdown. Both are worth fifteen minutes before you commit to a specific registration plate, and running the exact plate through PlateInsight before you view a car will show you its actual MOT history rather than a model-wide average.
Which Car Actually Suits You?
If you want the lower long-term MOT failure risk and don't mind paying a bit more to buy and service, the Golf is the sounder financial bet on this data. It's the car to choose if you're keeping it five-plus years and want fewer surprises as the miles pile on. What Car? owner satisfaction surveys have historically echoed this too, with Golf owners consistently rating perceived build quality highly.
The Focus still has a case. It's typically cheaper to buy used, cheaper to insure in a lot of brackets, and drives with more feel than most rivals in this class, a point Auto Trader reviews have made repeatedly over the years. If you're a first-time buyer on a tighter budget who wants a car that's genuinely fun to drive, and you're prepared to keep a closer eye on the electrics, a well-chosen later Focus isn't a bad decision. It just carries slightly more MOT risk over time than the Golf, and that's now backed by the numbers rather than just anecdote.
Frequently Asked Questions
Is the VW Golf more reliable than the Ford Focus?
Yes. Across 13,656,724 MOT tests from 2010-2022, the Golf scores 99 points higher and has a 3.6 percentage point higher pass rate than the Focus. The gap holds across almost every shared model year rather than being driven by one exceptional generation.
Which VW Golf years should you avoid?
The earliest years in this window, 2010-2012, show the lowest pass rates for the Golf, well below the model's later averages. See our full VW Golf year-by-year breakdown for the complete picture.
Which Ford Focus years should you avoid?
Focus pass rates before 2015 lag noticeably behind later cars, with 2013 standing out as a weak point in the run. Check our full Ford Focus year-by-year breakdown for year-by-year detail.
Is the Golf or Focus cheaper to run and insure?
The Focus typically sits in lower insurance groups and has a cheaper used market price than the Golf. The Golf's edge is in fewer MOT failures over time, which can offset some of that running cost gap in the long run.
Which is better as a first car?
The Focus is the more common first-car recommendation thanks to lower insurance and purchase costs, and its strong first MOT pass rate means early ownership is usually trouble-free. The Golf suits a buyer planning to keep the car longer and wanting fewer issues as it ages.
Our Verdict
A reliable model is only half the story. The exact VW Golf or Ford Focus you are looking at could be clocked, on outstanding finance, or a past write-off. Check the specific car before you commit.
The badge premium argument turns out to have some data behind it this time, even if the margin is narrower than VW's marketing department would like you to believe. Before you buy either car, run the specific plate through PlateInsight to see its actual MOT history rather than relying on model-wide averages. New users get 5 free credits to check exactly that.
You might also like
Check Any Vehicle's Full History
MOT results, mileage timeline, AI health score, and market valuations. New users get 5 free credits.