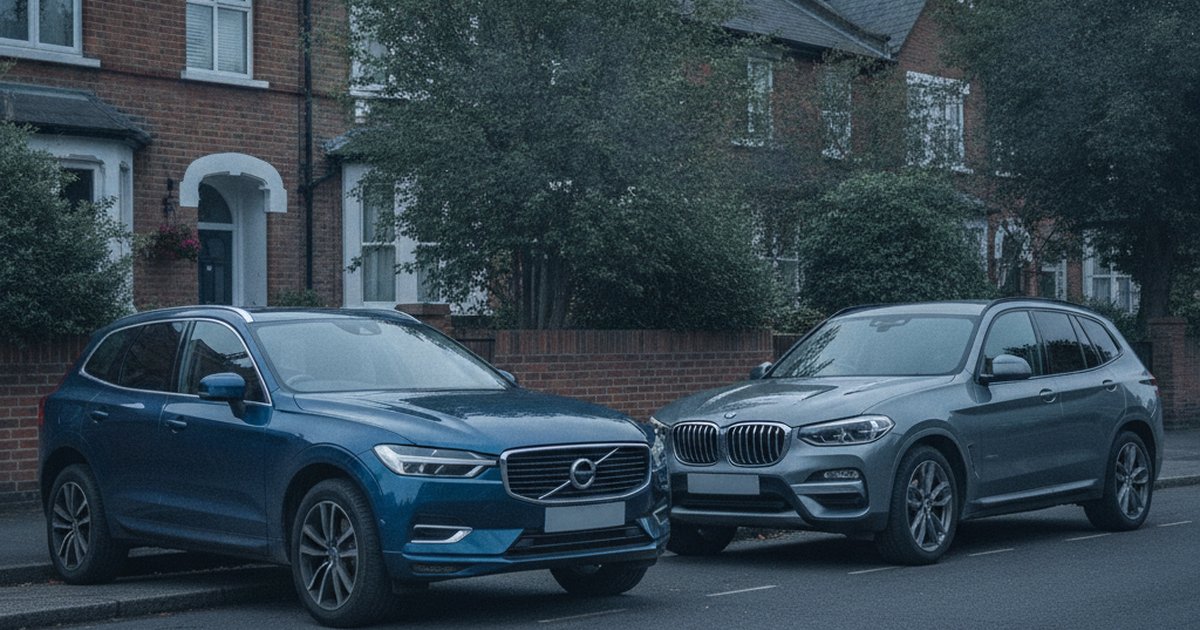
Both of these are the sort of premium SUV you buy to do a proper job: school runs, motorway commutes, the odd tow of a horsebox or a caravan. The Volvo XC60 trades on safety credentials and Scandinavian solidity. The BMW X3 sells itself on driving feel and badge prestige. But which one actually holds up better across hundreds of thousands of MOT tests? We pulled 1,477,765 MOT records covering both models across their shared production years (2010-2019) to find out, and the answer isn't quite what Volvo's marketing department would want you to hear.
The short version: The BMW X3 comes out ahead of the Volvo XC60 across our age-matched MOT data, with a higher pass rate, fewer defects per test, and a stronger first-MOT result. It's not a landslide, but it's a consistent gap that shows up year after year rather than a one-off blip.
The Data Verdict
The BMW X3 is the more reliable car, by 23 points
Like-for-like comparison across the years both cars were on sale (2010-2019), from 1,477,765 real DVSA MOT tests. Scores out of 1000, higher is better.
Head-to-Head: The Numbers (2010-2019)
| Metric | Volvo XC60 | BMW X3 |
|---|---|---|
| Reliability score (/1000) | 620 | 643 |
| MOT pass rate | 83.3% | 84.9% |
| First MOT pass rate (age 3) | 86.0% | 88.9% |
| Average defects per test | 1.40 | 1.25 |
| Typical annual mileage | 8,514 mi | 7,932 mi |
| MOT tests analysed | 826,383 | 651,382 |
| Vehicles tracked | 91,738 | 75,162 |
Pass Rate and Score, Year by Year
| Year | Volvo XC60 pass (score) | BMW X3 pass (score) | Stronger |
|---|---|---|---|
| 2010 | 79.1% (682) | 81.0% (702) | BMW X3 |
| 2011 | 79.5% (645) | 82.8% (719) | BMW X3 |
| 2012 | 79.7% (625) | 81.7% (660) | BMW X3 |
| 2013 | 81.6% (638) | 82.3% (641) | Even |
| 2014 | 82.3% (622) | 82.8% (609) | Volvo XC60 |
| 2015 | 83.5% (603) | 84.6% (615) | BMW X3 |
| 2016 | 83.9% (560) | 85.8% (598) | BMW X3 |
| 2017 | 86.9% (597) | 88.0% (618) | BMW X3 |
| 2018 | 89.9% (667) | 90.0% (659) | Even |
| 2019 | 90.1% (640) | 90.6% (661) | BMW X3 |
Shared years only. Volvo XC60 data also covers 2020; BMW X3 data also covers 2020-2021, covered in the full year-by-year guides below.
What Actually Fails on Each
Recorded defects and advisories per 100 MOT tests by DVSA inspection category, 2010-2019. A test can record more than one defect.
Volvo XC60
- Tyres, wheels and suspension: 54.9 per 100 tests typically around 70,000 miles
- Brakes: 30.2 per 100 tests typically around 69,500 miles
- Lights and electrics: 13.4 per 100 tests typically around 78,000 miles
- Other: 11.3 per 100 tests typically around 71,000 miles
- Visibility (wipers, washers, windscreen): 8.0 per 100 tests typically around 76,000 miles
BMW X3
- Tyres, wheels and suspension: 48.2 per 100 tests typically around 62,500 miles
- Brakes: 20.6 per 100 tests typically around 64,500 miles
- Other: 17.4 per 100 tests typically around 66,500 miles
- Lights and electrics: 11.6 per 100 tests typically around 71,500 miles
- Visibility (wipers, washers, windscreen): 8.2 per 100 tests typically around 66,000 miles
The Best Year to Buy Each
Reliability scores are age-adjusted: each year is judged against other cars of the same age. So when an older year out-scores a newer one, it means it holds up unusually well for its age, not that it will need less work than a much newer car. How our scores work.
Why Does the BMW X3 Win?
The gap between these two isn't huge, but it's persistent. The X3 posts a better pass rate and fewer defects per test than the XC60 across nearly every comparable year, and it manages that while covering slightly fewer annual miles. That last point matters: the X3 in this dataset averages under 8,000 miles a year against the XC60's figure closer to 8,500. Lighter use should, in theory, narrow the reliability gap in the Volvo's favour. It doesn't. The BMW still comes out ahead, which tells us the difference is down to the cars themselves rather than how owners use them.
Look at tyres, wheels and suspension, the single biggest source of defects on both cars, and the XC60 racks up noticeably more occurrences per 100 tests than the X3. Volvo's chassis and running gear seem to wear or get flagged more often, even though the mileage profile should be working in its favour. Brakes tell a similar story: the XC60 shows a meaningfully higher brake defect rate than the X3. None of this makes the Volvo a bad car, but it does mean the X3's reputation as the more mechanically sorted of the two holds up when you look at the actual test data rather than the badge on the bonnet.
What Do the Defect Patterns Actually Mean for a Buyer?
Both cars share the same top two failure categories, tyres/suspension and brakes, which is normal for a heavy, air-suspension-optional SUV doing family duty. The difference is scale. The XC60's suspension defect rate is higher, and those issues tend to surface at lower mileage than on the X3, based on the typical mileage figures attached to each defect category. That points to a car that's slightly harder on its own running gear, or fitted with components that don't last quite as long under UK roads and pothole abuse.
The XC60 also shows a wider gap between its first-MOT pass rate and its overall pass rate than the X3 does. That's worth flagging: a car that sails through its first MOT but then falls away faster as it ages is telling you something about how it degrades, not just whether it was built well on day one. Buyers shopping XC60s that are five or six years old should factor that in rather than assuming the strong early results carry on indefinitely.
Neither car shows a dangerous defect rate high enough to sound alarms here, so this isn't a safety story. It's a wear-and-tear story, and on that measure the X3 is the more resilient of the two.
Which Years Should You Buy or Avoid?
Timing matters more than badge here. On the Volvo side, the mid-2010s cars (2015 and 2016 in particular) show weaker age-adjusted scores despite reasonable pass rates, suggesting those model years picked up more defects per test than their age alone would predict. The strongest Volvo year in this window holds up unusually well for its age, but buyers should still budget for the wear that comes with any older car rather than assuming that score means low maintenance. For a full breakdown of which XC60 model years to chase and which to steer clear of, see our full Volvo XC60 year-by-year breakdown.
The BMW's pattern is a little different: its best-scoring year sits right at the start of this window, which again reflects strong performance for its age bracket rather than a claim that an older X3 needs less looking after than a newer one. If you want a newer X3, the later cars in this range post pass rates in the high 80s and low 90s, a solid sign for anyone shopping post-facelift examples. Full year-by-year detail is in our full BMW X3 year-by-year breakdown, including which specific years to avoid.
Which SUV Suits Which Buyer?
If you want the more dependable MOT record and don't mind giving up some of the Volvo's plush, safety-obsessed cabin feel, the X3 is the sounder buy on this data. It also tends to be driven slightly fewer miles a year in this sample, which pairs well with its stronger pass rate for anyone hunting a lightly-used example.
The XC60 still makes sense if you'd rather have Volvo's safety reputation, interior comfort and a more relaxed driving character than outright mechanical resilience, and you're prepared to be more disciplined about suspension and brake checks as the car ages. Anyone buying either car secondhand should run a gov.uk MOT history check on the specific vehicle, since individual history varies a lot from these aggregate averages, and cross-reference it against reliability commentary from sources like What Car? before you commit.
Frequently Asked Questions
Is the Volvo XC60 more reliable than the BMW X3?
No. Across 1,477,765 MOT tests in our shared 2010-2019 window, the BMW X3 posts a higher pass rate, fewer defects per test, and a stronger first-MOT pass rate than the Volvo XC60. The gap is consistent across most comparable years rather than a one-off result.
Which Volvo XC60 years should you avoid?
The mid-2010s cars, particularly 2015 and 2016, show weaker age-adjusted scores despite decent pass rates, suggesting more defects per test than expected for their age. See our full XC60 year-by-year breakdown for specifics.
Which BMW X3 years should you avoid?
The X3's scores dip through the middle of the shared window (roughly 2014-2016) before recovering strongly from 2017 onwards. Check our full X3 year-by-year breakdown for the detail on which specific years underperform.
Which is cheaper to run, the XC60 or the X3?
Our MOT data doesn't cover insurance or fuel costs directly, but the X3's lower defect rate per test points to fewer unexpected repair bills. For insurance quotes and running cost comparisons, check current figures via the RAC or a comparison site, since premiums depend heavily on engine and trim.
Is either the Volvo XC60 or BMW X3 a good first car?
Neither is a typical first car choice given their size, running costs and insurance groups. Both suit experienced drivers wanting a family SUV, with the X3 the safer bet on mechanical reliability based on this data.
Our Verdict
A reliable model is only half the story. The exact Volvo XC60 or BMW X3 you are looking at could be clocked, on outstanding finance, or a past write-off. Check the specific car before you commit.
Numbers like these only tell you the average story. The specific car you're looking at might have a pristine history or a rough one, which is why it's worth checking before you hand over a deposit. Run the exact XC60 or X3 you're considering through PlateInsight, you get 5 free credits to see its full MOT history, mileage pattern and defect record before you buy.
You might also like
Check Any Vehicle's Full History
MOT results, mileage timeline, AI health score, and market valuations. New users get 5 free credits.