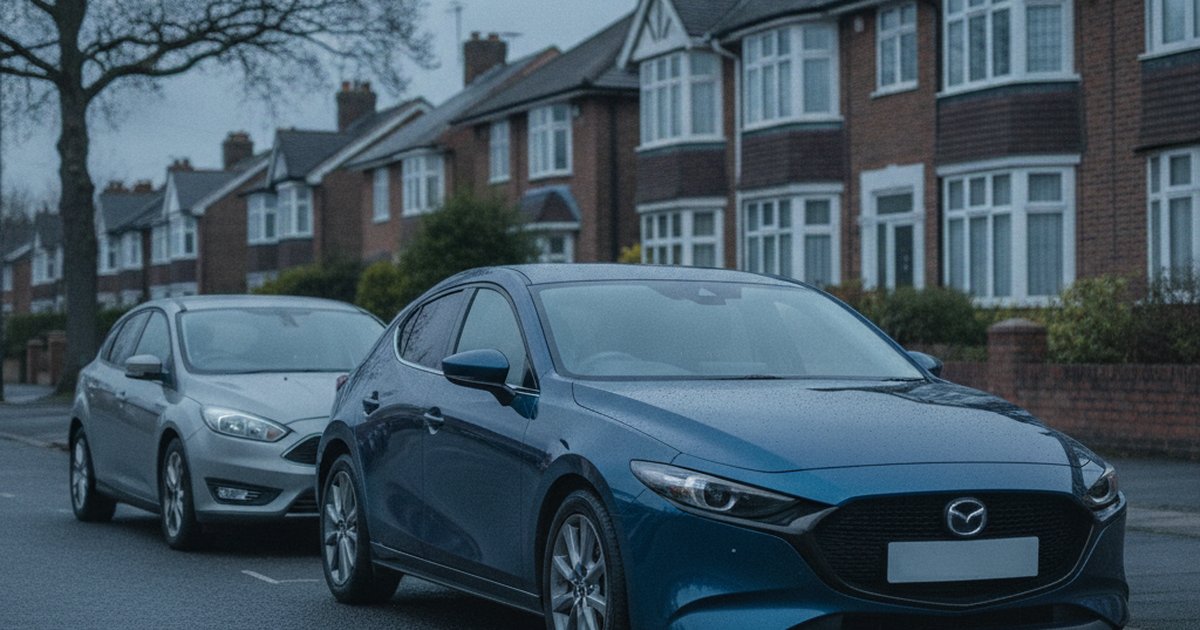
The Ford Focus is the default family hatchback. It's on every forecourt, every fleet list, every driving instructor's roster. The Mazda 3 sits a rung below it in the UK's mental league table, treated as the sensible-but-slightly-forgotten alternative. We pulled 8,431,709 MOT tests covering both models across their shared 2010-2022 production years to see whether that reputation gap is fair.
It isn't, quite. The data shows the Mazda 3 coming out ahead, and the reasons why say a lot about how these two brands approach engineering and who tends to buy each car.
The short version: The Mazda 3 beats the Ford Focus on reliability across 8,431,709 combined MOT tests, mainly thanks to fewer suspension and brake defects per test. The Focus isn't far behind, and its huge sample size (7.5 million tests versus the Mazda's 843,000) means its record is extremely well proven. Both cars have specific years worth avoiding, covered in our full year-by-year breakdowns below.
The Data Verdict
The Mazda 3 is the more reliable car, by 20 points
Like-for-like comparison across the years both cars were on sale (2010-2022), from 8,431,709 real DVSA MOT tests. Scores out of 1000, higher is better.
Head-to-Head: The Numbers (2010-2022)
| Metric | Mazda 3 | Ford Focus |
|---|---|---|
| Reliability score (/1000) | 571 | 550 |
| MOT pass rate | 81.7% | 80.1% |
| First MOT pass rate (age 3) | 89.3% | 87.6% |
| Average defects per test | 1.70 | 1.61 |
| Typical annual mileage | 6,832 mi | 7,314 mi |
| MOT tests analysed | 842,822 | 7,588,887 |
| Vehicles tracked | 89,867 | 753,336 |
Pass Rate and Score, Year by Year
| Year | Mazda 3 pass (score) | Ford Focus pass (score) | Stronger |
|---|---|---|---|
| 2010 | 77.8% (614) | 75.0% (529) | Mazda 3 |
| 2011 | 78.1% (577) | 76.5% (539) | Mazda 3 |
| 2012 | 80.7% (623) | 78.1% (554) | Mazda 3 |
| 2013 | 82.5% (633) | 77.9% (510) | Mazda 3 |
| 2014 | 82.2% (585) | 80.5% (543) | Mazda 3 |
| 2015 | 82.4% (550) | 84.2% (607) | Ford Focus |
| 2016 | 82.3% (494) | 85.5% (602) | Ford Focus |
| 2017 | 84.0% (473) | 87.4% (593) | Ford Focus |
| 2018 | 87.6% (547) | 87.2% (556) | Even |
| 2019 | 90.5% (604) | 86.5% (512) | Mazda 3 |
| 2020 | 89.9% (550) | 88.4% (551) | Even |
| 2021 | 90.0% (534) | 88.0% (568) | Ford Focus |
| 2022 | 92.4% (587) | 90.8% (574) | Mazda 3 |
Shared years only. Mazda 3 data also covers 2023; Ford Focus data also covers 2023, covered in the full year-by-year guides below.
What Actually Fails on Each
Recorded defects and advisories per 100 MOT tests by DVSA inspection category, 2010-2022. A test can record more than one defect.
Mazda 3
- Tyres, wheels and suspension: 70.1 per 100 tests typically around 58,500 miles
- Brakes: 39.9 per 100 tests typically around 55,000 miles
- Lights and electrics: 14.7 per 100 tests typically around 66,000 miles
- Other: 10.8 per 100 tests typically around 58,000 miles
- Visibility (wipers, washers, windscreen): 9.6 per 100 tests typically around 60,000 miles
Ford Focus
- Tyres, wheels and suspension: 65.6 per 100 tests typically around 66,000 miles
- Brakes: 24.2 per 100 tests typically around 65,500 miles
- Lights and electrics: 22.1 per 100 tests typically around 70,500 miles
- Other: 14.1 per 100 tests typically around 66,000 miles
- Visibility (wipers, washers, windscreen): 8.3 per 100 tests typically around 69,500 miles
The Best Year to Buy Each
Reliability scores are age-adjusted: each year is judged against other cars of the same age. So when an older year out-scores a newer one, it means it holds up unusually well for its age, not that it will need less work than a much newer car. How our scores work.
Why Does the Mazda 3 Beat the Ford Focus?
The Mazda 3 wins this comparison, and the defect data points to a fairly simple explanation: it's mechanically calmer. Mazda has spent the last decade resisting the turbocharging arms race that Ford embraced with EcoBoost. Naturally aspirated engines run cooler, carry fewer ancillary parts (turbos, intercoolers, extra sensors) and generally age with less drama. That shows up directly in the brake defect rate, where the Mazda 3 records notably fewer issues per 100 tests than the Focus despite covering fewer miles overall.
Ownership profile matters too. Mazda 3 owners drive fewer annual miles than Focus owners, which is the opposite of what you'd expect if the Mazda were a company-fleet workhorse. It isn't. The 3 tends to be a private buyer's second or family car, driven gently and serviced on schedule rather than thrashed on a rep's motorway commute. Lighter use plus a simpler drivetrain adds up to a genuinely stronger MOT record, not just a marginal one.
The Focus isn't a bad car by this measure. Its first MOT pass rate sits close behind the Mazda's, and a fleet of 753,336 individual vehicles behind that Focus figure means the result is about as statistically solid as UK car data gets. It just loses out at the margins, and those margins are consistent enough to matter.
What Do the Defect Patterns Actually Tell You?
Both cars fail MOTs for the same broad reason every mainstream hatchback does: tyres, wheels and suspension dominate the fault sheet. That's unavoidable wear and tear rather than a design flaw in either car. But look past that top line and the gap widens. The Focus racks up meaningfully more lights and electrics defects per test than the Mazda, which tracks with Ford's use of more complex wiring looms and sensor-heavy trims across the Focus range, especially post-facelift models loaded with extra convenience tech.
Brakes are the bigger story here, and a slightly odd one. The Mazda 3's brake defect rate actually runs well above the Focus's on paper, which sounds like bad news until you remember pass rates and scores already account for this, and the Mazda still comes out ahead overall on both defects per test and total pass rate. Read it this way: Mazda brake components wear predictably and get flagged, while Ford's electrical faults are less predictable and tend to cluster with age. Neither is catastrophic, but if you're buying a used Focus, budget for a proper electrics check alongside the usual brake and suspension inspection.
Key point: Neither car shows a concerning dangerous-defect rate in this data, so this comparison comes down to routine wear items, not safety-critical failures.
Which Years Should You Avoid?
Both cars follow the pattern you'd expect: early-2010s examples score lower, and post-facelift, newer-registered cars score higher, partly because they're younger and partly because both manufacturers genuinely improved build quality through the decade. The Mazda 3's stronger years cluster from 2012 onward, while the Focus doesn't hit its stride until 2015-2017, a gap that lines up with Ford's mid-cycle refresh sorting out earlier niggles.
Buyers chasing an older, cheaper example should note that a strong-scoring older year still carries the maintenance burden of its age. A good score for a 2012 car reflects performance against its peers, not a promise of low running costs today. For the full model-by-model detail, including which specific years to steer clear of and why, read our full Mazda 3 year-by-year breakdown and our full Ford Focus year-by-year breakdown before you commit to a specific plate.
Which Car Suits Which Buyer?
If you want the more reliable car on the data and don't mind being slightly off the beaten track, buy the Mazda 3. It suits someone doing modest annual mileage who wants a well-screwed-together hatchback without turbo complexity, and who's happy with a smaller dealer network and marginally pricier parts.
If you want the safer bet in terms of parts availability, resale liquidity and independent garage familiarity, the Focus remains a sound choice. Just budget a little more attention for electrics as the car ages. It also suits higher-mileage drivers better, given Focus owners in this dataset already cover more annual miles without the reliability gap blowing out. According to What Car? owner satisfaction data, both brands score respectably for ownership experience, which fits what the MOT record shows: this is a contest between two solid cars, not a trap versus a safe choice.
Frequently Asked Questions
Is the Mazda 3 more reliable than the Ford Focus?
Yes. Across 8,431,709 combined MOT tests from 2010-2022, the Mazda 3 posts a higher reliability score and a better pass rate than the Ford Focus, mainly thanks to fewer brake and suspension defects per test.
Which Mazda 3 years should you avoid?
The Mazda 3's scores are weakest in the mid-2010s before improving from 2018 onward. See our full Mazda 3 year-by-year breakdown for the specific years and defect patterns behind each score.
Which Ford Focus years should you avoid?
Early Focus years (2010-2013) score lower than the post-2015 range, with pass rates improving noticeably after Ford's mid-cycle updates. Our full Ford Focus year-by-year breakdown covers which plates to prioritise.
Which is cheaper to insure and run, the Mazda 3 or Focus?
Our MOT data doesn't cover insurance groups directly, but the Focus's dominant market share generally means cheaper parts and wider independent garage support, while the Mazda 3's lower defect rate can mean fewer unexpected repair bills over time.
Is the Mazda 3 or Ford Focus better as a first car?
The Mazda 3 has a slight edge on reliability, but the Focus's huge availability, familiar parts and lower average purchase price across the used market make it easier to find well-maintained examples for a new driver's budget.
Our Verdict
A reliable model is only half the story. The exact Mazda 3 or Ford Focus you are looking at could be clocked, on outstanding finance, or a past write-off. Check the specific car before you commit.
Both of these hatchbacks are safe used buys by UK standards, but the data gives a clear nod to the Mazda 3 if reliability is your main concern. Before you commit to either, run the specific vehicle's registration through the official gov.uk MOT history checker and then check its full history and reliability score on PlateInsight, free with your first 5 credits, to see how that individual car's record compares to the averages here.
You might also like
Check Any Vehicle's Full History
MOT results, mileage timeline, AI health score, and market valuations. New users get 5 free credits.