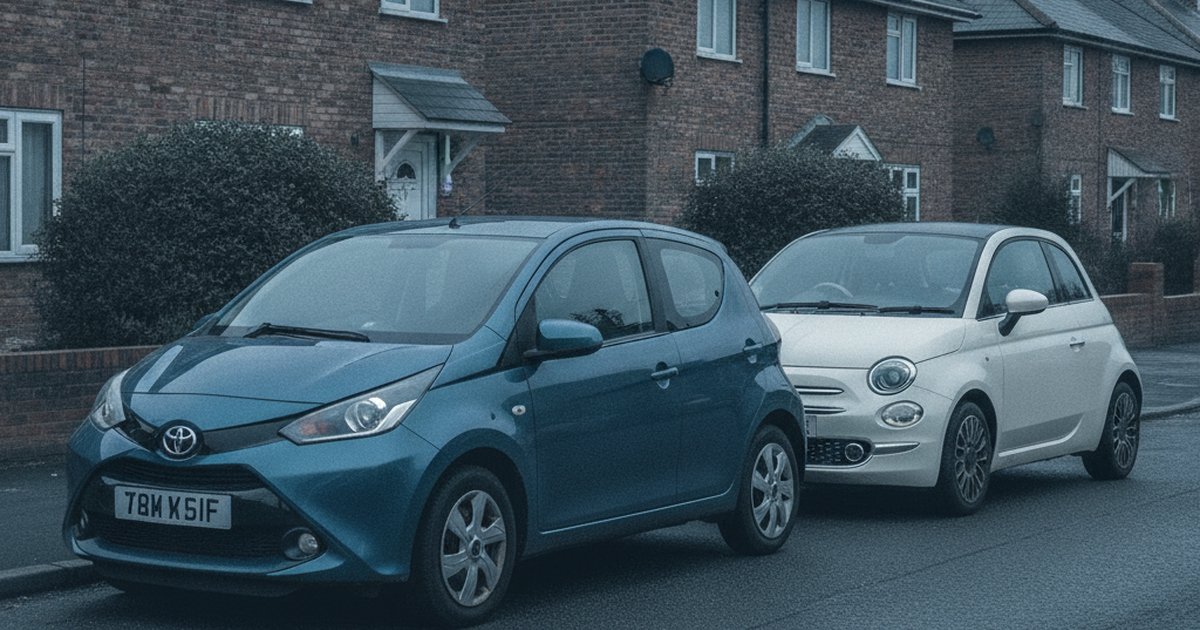
The Aygo and the 500 are pitched at the same buyer: someone wanting a cheap-to-run, easy-to-park first car with low insurance and lower running costs. They're cross-shopped constantly, and on paper they look similar, small petrol engines, city-focused, plentiful on the used market. But 4,881,227 MOT tests across both models tell a much less even story than the showroom brochures suggest.
We pulled the age-matched MOT records for both cars from 2010 to 2020 to see which one actually holds up on British roads, rather than which one looks better in a car park.
The short version: The Toyota Aygo beats the Fiat 500 by 161 points in our reliability scoring, backed by a 5.9 percentage point pass rate advantage. The gap comes almost entirely from suspension and tyre-related failures, where the 500 is significantly more failure-prone than the Aygo at comparable mileages. The 500 is charming and cheap to insure, but the data says the Aygo is the safer used buy.
The Data Verdict
The Toyota Aygo is the more reliable car, by 160 points
Like-for-like comparison across the years both cars were on sale (2010-2020), from 4,881,227 real DVSA MOT tests. Scores out of 1000, higher is better.
Head-to-Head: The Numbers (2010-2020)
| Metric | Toyota Aygo | Fiat 500 |
|---|---|---|
| Reliability score (/1000) | 569 | 408 |
| MOT pass rate | 84.0% | 78.1% |
| First MOT pass rate (age 3) | 89.0% | 85.2% |
| Average defects per test | 1.48 | 1.93 |
| Typical annual mileage | 4,732 mi | 4,858 mi |
| MOT tests analysed | 1,858,060 | 3,023,167 |
| Vehicles tracked | 206,161 | 284,862 |
Pass Rate and Score, Year by Year
| Year | Toyota Aygo pass (score) | Fiat 500 pass (score) | Stronger |
|---|---|---|---|
| 2010 | 78.5% (568) | 73.3% (404) | Toyota Aygo |
| 2011 | 78.9% (542) | 74.3% (397) | Toyota Aygo |
| 2012 | 80.1% (551) | 75.6% (406) | Toyota Aygo |
| 2013 | 81.6% (553) | 77.7% (434) | Toyota Aygo |
| 2014 | 83.8% (578) | 78.1% (400) | Toyota Aygo |
| 2015 | 86.5% (609) | 78.8% (369) | Toyota Aygo |
| 2016 | 87.7% (608) | 81.3% (403) | Toyota Aygo |
| 2017 | 88.8% (574) | 84.3% (427) | Toyota Aygo |
| 2018 | 88.9% (549) | 85.6% (447) | Toyota Aygo |
| 2019 | 89.8% (549) | 87.3% (468) | Toyota Aygo |
| 2020 | 90.5% (543) | 88.6% (489) | Toyota Aygo |
Shared years only. Toyota Aygo data also covers 2021-2022; Fiat 500 data also covers 2021, covered in the full year-by-year guides below.
What Actually Fails on Each
Recorded defects and advisories per 100 MOT tests by DVSA inspection category, 2010-2020. A test can record more than one defect.
Toyota Aygo
- Tyres, wheels and suspension: 61.9 per 100 tests typically around 42,500 miles
- Brakes: 34.1 per 100 tests typically around 43,500 miles
- Lights and electrics: 15.3 per 100 tests typically around 48,000 miles
- Visibility (wipers, washers, windscreen): 9.1 per 100 tests typically around 45,000 miles
- Other: 7.1 per 100 tests typically around 43,000 miles
Fiat 500
- Tyres, wheels and suspension: 86.8 per 100 tests typically around 44,000 miles
- Brakes: 26.8 per 100 tests typically around 44,000 miles
- Lights and electrics: 16.0 per 100 tests typically around 47,500 miles
- Other: 15.2 per 100 tests typically around 46,000 miles
- Visibility (wipers, washers, windscreen): 10.5 per 100 tests typically around 45,500 miles
The Best Year to Buy Each
Reliability scores are age-adjusted: each year is judged against other cars of the same age. So when an older year out-scores a newer one, it means it holds up unusually well for its age, not that it will need less work than a much newer car. How our scores work.
Why Does the Toyota Aygo Score Higher?
The headline gap between these two cars isn't about engines blowing up or gearboxes failing. It's about the unglamorous stuff: suspension, wheels and tyres. Both cars pick up more defects in this category than anywhere else, which is normal for small city cars that spend their lives bouncing over potholes and speed bumps. But the 500 racks up defects here at a considerably higher rate than the Aygo, and that single category explains most of the reliability gap between them.
Toyota's reputation for building unglamorous but sturdy running gear shows up clearly here. The Aygo's suspension and steering components seem to tolerate the daily grind of UK city driving noticeably better than the 500's. Neither car is driven especially hard, both average under 5,000 miles a year, so this isn't a case of one being thrashed more than the other. These are gentle-use cars in both camps. The difference is mechanical, not down to driving style.
The Aygo also needed fewer defects fixed per test on average, which matters at MOT time because it usually means a shorter list of advisories and a smaller bill, even when both cars pass.
What Do the Defect Patterns Mean for a Buyer?
Look past the suspension gap and the two cars are closer than you'd expect. Both show broadly similar rates of lights and electrics faults, and similar visibility issues with wipers and washers. Where they diverge again is brakes: the Aygo actually shows a higher brake defect rate than the 500, a useful reminder that no car in this class is faultless. If you're buying either one, get the brakes checked properly regardless of badge.
The 500 also shows a noticeably higher rate of 'Other' and body/structure/exhaust defects than the Aygo. Fiat's smaller-volume UK dealer network and parts supply chain have historically had a mixed reputation according to What Car? owner satisfaction surveys, and general corrosion and exhaust wear turning up more often in the 500's data fits that pattern. It's not a dealbreaker on its own, but it adds to the picture of the 500 needing more attention over time.
Practically, this means an Aygo owner is more likely to sail through an MOT with nothing more than an advisory, while a 500 owner should budget for slightly more frequent suspension and bodywork work as the car ages.
Which Years Should You Buy, and Which Should You Avoid?
Both cars follow the pattern you'd expect: pass rates climb steadily as you move into newer model years, reflecting less accumulated wear rather than any major design change. Early 2010-2012 examples of both cars score lowest and should be approached cautiously unless the price reflects their age and mileage.
For the Aygo, the standout is a mid-cycle year that holds up unusually well for its age, scoring close to the best examples in the entire range despite not being the newest car available. It's a genuine value pick if you find one with a solid service history, though the caveat always applies: it's still an older car and will need normal wear items addressing regardless of how well it scored in period.
The 500's strongest year sits right at the end of the shared window, meaning the newest examples you can find are also the most dependable ones in the dataset, a straightforward case of buy as new as your budget allows. For a full breakdown of which specific years to target or avoid on each model, see our full Toyota Aygo year-by-year breakdown and our full Fiat 500 year-by-year breakdown. Either way, always run the specific registration through the official gov.uk MOT history checker before you commit, and cross-reference it with PlateInsight for the fuller defect history.
Which City Car Suits Which Buyer?
If you want the most dependable car for the least hassle, the Aygo is the clear choice. It's cheaper to keep running, less likely to throw up surprise suspension bills, and Toyota's parts availability and dealer network coverage is stronger nationwide, useful if you're a new driver without a trusted local mechanic yet.
The 500 still has a case. It's arguably more characterful, holds strong residual values thanks to its styling, and insurance groups for both cars are low enough that neither will break a first-time driver's budget, though that's worth confirming directly with your insurer or comparing via the AA. If you're set on the 500's image and are prepared to budget more for suspension and bodywork upkeep, it remains a usable choice, just not the safer one on the data.
For pure first-car practicality, cost of ownership and fewer unexpected MOT bills, the Aygo wins this comparison comfortably.
Frequently Asked Questions
Is the Toyota Aygo more reliable than the Fiat 500?
Yes. Across 4,881,227 MOT tests from 2010-2020, the Aygo scores 161 points higher than the 500 and has a 5.9 percentage point better pass rate. The gap comes mainly from far fewer suspension and tyre defects.
Which Toyota Aygo years should you avoid?
Early 2010-2012 Aygos score lowest in our data, reflecting age and accumulated wear rather than a specific fault. See our full Aygo year-by-year breakdown for the exact figures on each model year.
Which Fiat 500 years should you avoid?
The 500's earliest years, 2010-2011, score lowest and show the weakest pass rates in the dataset. Pass rates improve steadily each year after, with the newest examples performing best. Check our full Fiat 500 year-by-year breakdown for details.
Which is cheaper to insure and run as a first car?
Both sit in low insurance groups typical of city cars, so the difference there is marginal and worth confirming with your own insurer. Where they differ is running costs over time: the Aygo's lower defect rate per MOT generally means fewer unexpected repair bills.
Which is the better first car overall?
The Aygo, based on this data. It combines a stronger pass rate, fewer defects per test and a better-holding suspension and steering setup, making it the lower-risk choice for a new driver's first car.
Our Verdict
A reliable model is only half the story. The exact Toyota Aygo or Fiat 500 you are looking at could be clocked, on outstanding finance, or a past write-off. Check the specific car before you commit.
Numbers only tell you about the model in general. The specific car you're looking at could have a flawless history or a string of red flags no dataset can predict. Before you hand over any money, run the registration through PlateInsight, you get 5 free credits to check full MOT history, mileage patterns and defect records on any UK-plated Aygo, 500, or anything else on your shortlist.
You might also like
Check Any Vehicle's Full History
MOT results, mileage timeline, AI health score, and market valuations. New users get 5 free credits.