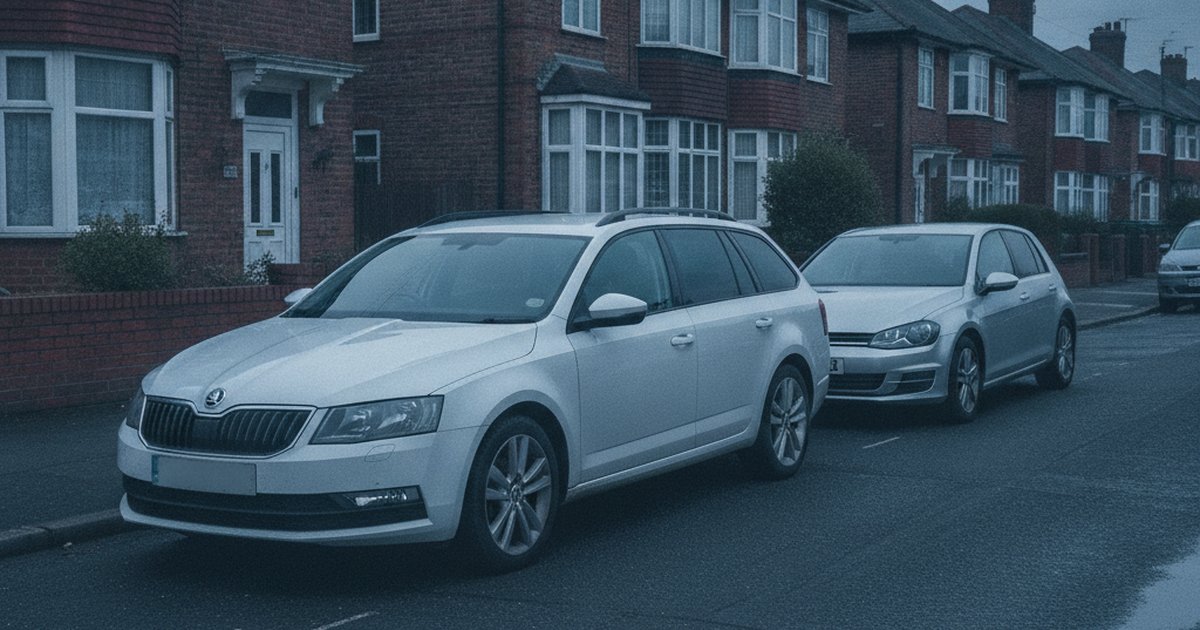
The Octavia and Golf share a platform, share engines, and in some generations share more or less everything except the badge and the boot size. So the question buyers actually ask isn't "which is the better car" in the abstract, it's "why would I pay more for the Golf badge when the Skoda gets me the same mechanicals and more space?" We pulled 7,760,310 MOT tests covering both models across their shared 2010-2020 production years to find out whether that logic holds up once you look at actual failure and defect data, not just spec sheets.
Both cars come from the same corner of the VW Group empire, so you'd expect the reliability story to be close. It is close. But it isn't a tie, and the direction of the gap is worth understanding before you commit.
The short version: The Skoda Octavia edges out the VW Golf on our reliability score across 7,760,310 combined MOT tests from 2010-2020, despite the Golf posting a marginally higher raw pass rate. The difference comes down to how each car performs against others of the same age, not just whether it passes or fails on the day.
The Data Verdict
The Skoda Octavia is the more reliable car, by 20 points
Like-for-like comparison across the years both cars were on sale (2010-2020), from 7,760,310 real DVSA MOT tests. Scores out of 1000, higher is better.
Head-to-Head: The Numbers (2010-2020)
| Metric | Skoda Octavia | VW Golf |
|---|---|---|
| Reliability score (/1000) | 670 | 649 |
| MOT pass rate | 83.3% | 83.7% |
| First MOT pass rate (age 3) | 87.5% | 85.5% |
| Average defects per test | 1.61 | 1.55 |
| Typical annual mileage | 9,870 mi | 7,691 mi |
| MOT tests analysed | 1,673,253 | 6,087,057 |
| Vehicles tracked | 186,794 | 645,622 |
Pass Rate and Score, Year by Year
| Year | Skoda Octavia pass (score) | VW Golf pass (score) | Stronger |
|---|---|---|---|
| 2010 | 77.7% (653) | 78.2% (637) | Skoda Octavia |
| 2011 | 79.2% (659) | 79.1% (624) | Skoda Octavia |
| 2012 | 79.1% (629) | 80.9% (643) | VW Golf |
| 2013 | 82.6% (703) | 83.6% (685) | Skoda Octavia |
| 2014 | 84.6% (720) | 85.1% (685) | Skoda Octavia |
| 2015 | 85.3% (694) | 86.6% (676) | Skoda Octavia |
| 2016 | 86.6% (690) | 87.5% (658) | Skoda Octavia |
| 2017 | 87.9% (666) | 88.3% (626) | Skoda Octavia |
| 2018 | 88.3% (655) | 88.4% (602) | Skoda Octavia |
| 2019 | 87.8% (611) | 89.9% (623) | VW Golf |
| 2020 | 88.6% (606) | 91.7% (631) | VW Golf |
Shared years only. Skoda Octavia data also covers 2021-2022; VW Golf data also covers 2021-2023, covered in the full year-by-year guides below.
What Actually Fails on Each
Recorded defects and advisories per 100 MOT tests by DVSA inspection category, 2010-2020. A test can record more than one defect.
Skoda Octavia
- Tyres, wheels and suspension: 69.5 per 100 tests typically around 83,000 miles
- Brakes: 29.5 per 100 tests typically around 85,500 miles
- Lights and electrics: 16.4 per 100 tests typically around 92,000 miles
- Other: 10.9 per 100 tests typically around 85,000 miles
- Visibility (wipers, washers, windscreen): 8.0 per 100 tests typically around 90,500 miles
VW Golf
- Tyres, wheels and suspension: 72.4 per 100 tests typically around 67,500 miles
- Brakes: 26.8 per 100 tests typically around 68,000 miles
- Other: 11.8 per 100 tests typically around 69,500 miles
- Lights and electrics: 11.6 per 100 tests typically around 75,000 miles
- Visibility (wipers, washers, windscreen): 9.0 per 100 tests typically around 70,500 miles
The Best Year to Buy Each
Reliability scores are age-adjusted: each year is judged against other cars of the same age. So when an older year out-scores a newer one, it means it holds up unusually well for its age, not that it will need less work than a much newer car. How our scores work.
Why Does the Octavia Come Out on Top?
Look at the headline pass rates and you'd think the Golf has it. Its raw pass rate is a fraction higher than the Octavia's. But our reliability score doesn't just measure pass or fail, it weighs performance against age-matched peers, and here the Octavia pulls ahead by a real margin. Its age-adjusted scores are consistently stronger year for year, particularly in the earlier part of the shared window when both cars were newer.
Part of the explanation is mileage. Octavia owners in this dataset cover noticeably more miles per year than Golf owners. That's a car doing more motorway commuting and family duty, the kind of use that tends to keep components exercised rather than seized or perished from sitting. Despite the harder mileage, the Octavia still comes out ahead on the age-adjusted score, which says something about how well the mechanicals cope with real use rather than gentle short runs.
The Golf, meanwhile, is doing fewer annual miles on average, which usually flatters a reliability score rather than hurting it. That the Octavia still wins despite the tougher mileage profile is the more telling result here.
What Do the Defect Patterns Actually Tell You?
Both cars fail MOTs for the same reasons in roughly the same order: tyres, wheels and suspension first, brakes second, then lights and electrics. That's normal for cars of this age and mileage, and it points to wear items rather than design flaws in either car.
The interesting detail is at what mileage these defects tend to show up. Golf defects across every major category cluster at lower mileage than the equivalent Octavia defects, roughly the mid-to-high 60,000s to low 70,000s for the Golf versus the mid-80,000s to low 90,000s for the Octavia. Since Golf owners in this data drive fewer miles a year, that lower defect mileage isn't really an endurance story, it's a timing story: these Golfs hit the same wear points sooner in calendar terms even though they're covering less ground. The Octavia's defects turn up later in the odometer's life, which lines up with its stronger age-adjusted showing.
Neither car throws up an alarming rate of dangerous defects in this data, so this isn't a safety argument either way. It's about which one nickel-and-dimes you sooner during ownership.
Which Years Should You Buy, and Which Should You Avoid?
Both cars follow the pattern you'd expect: earlier examples in this window scored lower before a mid-decade high point, then scores drift down again as newer, harder-driven examples enter the data. Younger cars simply haven't had time to accumulate the mileage that flatters an age-adjusted score, and first-year niggles pull scores down too.
For the Octavia, the standout is a car from the middle of the shared window that holds up unusually well for its age, comfortably the strongest score in the range even against some newer years. It's a genuine value pick, though buyers should remember that being an older car still means more accumulated wear regardless of how well it scores against peers of the same vintage. For the full breakdown of which specific years to prioritise and which to steer clear of, see our full Skoda Octavia year-by-year breakdown.
The Golf's best-scoring year sits a year later in the same window and shows the same pattern, a strong showing for its age that beats both older and newer alternatives on the balance of pass rate and score. If you're cross-shopping specific model years, our full VW Golf year-by-year breakdown covers which years to avoid and why.
The takeaway for both cars: don't assume newer is always better within this window. The mid-decade years for each model do the best job of balancing modern refinements against enough time on the road to prove themselves reliable.
So Which One Should You Actually Buy?
If your priority is squeezing the most reliable car out of your budget, the data backs the classic advice: the Octavia is the smarter buy. You get the same drivetrains as the Golf, a bigger boot, and, on this evidence, a car that holds up better against its peers even while covering more annual miles. It suits family buyers, high-mileage commuters, and anyone who wants VW Group engineering without the VW Group price premium.
The Golf's case isn't nothing, though. It's doing fewer miles a year in this dataset, which typically points to a more relaxed ownership pattern: second-car use, shorter commutes, less demanding duty cycles. If you fit that profile and value the badge, the interior finish, or simply prefer the Golf's size for city driving, you're not buying an unreliable car. You're just paying more for a slightly less resilient one on this data.
Either way, don't buy on badge reputation alone. Check the specific vehicle's MOT history before you hand over money. A Golf with a clean run of tests can easily outlast an Octavia with a chequered one, and PlateInsight will show you that history for any plate in seconds.
Frequently Asked Questions
Is the Skoda Octavia more reliable than the VW Golf?
On our age-adjusted reliability score, yes, the Octavia scores 21 points higher across 7,760,310 combined MOT tests from 2010-2020, despite the Golf having a marginally higher raw pass rate. The Octavia also does this while covering more annual miles on average.
Which Skoda Octavia years should you avoid?
The earliest years in the 2010-2020 window score noticeably lower, with the strongest performance clustering in the middle of the decade. See our full Skoda Octavia year-by-year breakdown for specifics on which years to prioritise.
Which VW Golf years should you avoid?
Similarly to the Octavia, the earliest Golf years in this window score lowest, with a stronger mid-decade peak. Our full VW Golf year-by-year breakdown covers the year-by-year detail.
Which is cheaper to run, the Octavia or the Golf?
Both use shared VW Group engines and parts, so servicing and repair costs are broadly similar. The Octavia's later-onset defects suggest slightly lower unplanned repair frequency over time, which can offset any difference in list price or insurance grouping.
Which is better as a first car, the Octavia or the Golf?
The Golf's lower average annual mileage in this data suggests a gentler ownership pattern typical of newer or lighter-use drivers, which could suit a first-time buyer. The Octavia is the better choice if you need the extra boot space or expect to cover more miles.
Our Verdict
A reliable model is only half the story. The exact Skoda Octavia or VW Golf you are looking at could be clocked, on outstanding finance, or a past write-off. Check the specific car before you commit.
Numbers like these only tell you about the model as a whole, not the specific car in front of you. Before you buy either an Octavia or a Golf, run its exact plate through PlateInsight to see its full MOT history, past defects and mileage pattern. New users get 5 free credits to check their first few cars, no card required.
You might also like
Check Any Vehicle's Full History
MOT results, mileage timeline, AI health score, and market valuations. New users get 5 free credits.