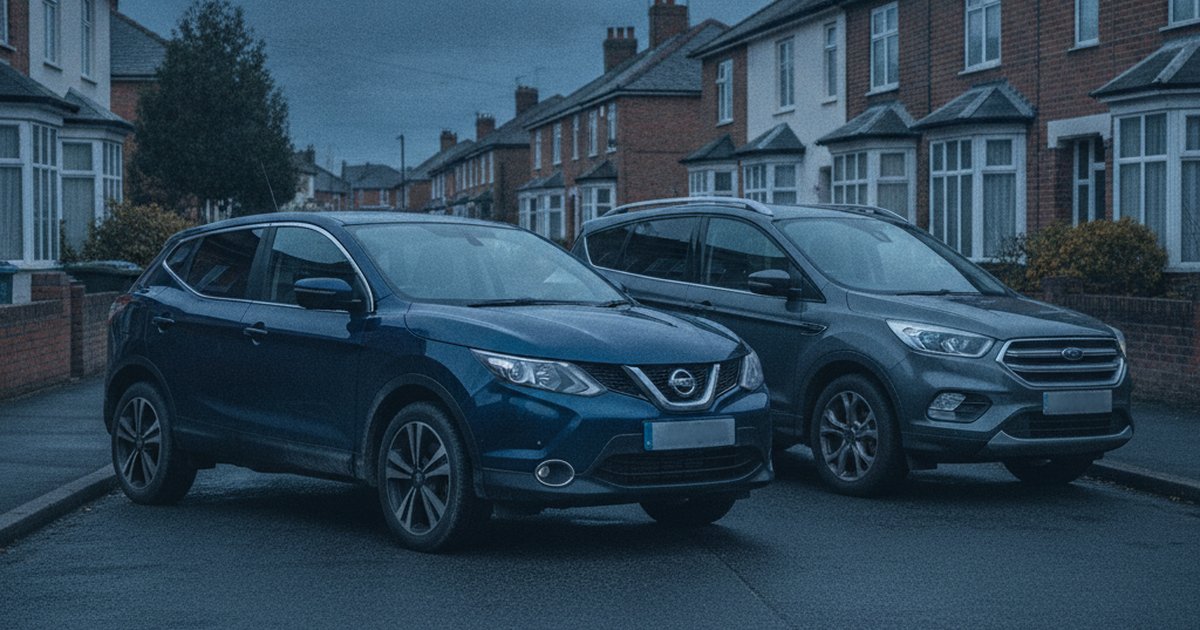
The Qashqai basically built the family crossover segment in the UK, and it's still the default choice on most school runs. The Kuga has spent a decade trying to poach those buyers with a bit more driving enjoyment and a roomier boot. Both are everywhere on used car lots, which means both have left a huge trail of MOT history behind them.
We pulled 7,165,329 MOT tests covering both models across shared production years from 2010 to 2020, using PlateInsight's database of 261 million MOT records. Age-matching the two means we're comparing like-for-like: a 2015 Qashqai against a 2015 Kuga, not a tired old Qashqai against a nearly-new Kuga. The result isn't close.
The short version: The Ford Kuga beats the Nissan Qashqai on reliability by a clear margin across the 2010-2020 window, with a better pass rate and noticeably fewer defects per test. The Qashqai isn't a bad car, but it picks up tyre, suspension and brake issues far more often than the Kuga does, and both models needed until roughly 2014 to shake off genuinely weak early scores.
The Data Verdict
The Ford Kuga is the more reliable car, by 90 points
Like-for-like comparison across the years both cars were on sale (2010-2020), from 7,165,329 real DVSA MOT tests. Scores out of 1000, higher is better.
Head-to-Head: The Numbers (2010-2020)
| Metric | Nissan Qashqai | Ford Kuga |
|---|---|---|
| Reliability score (/1000) | 489 | 579 |
| MOT pass rate | 79.3% | 83.8% |
| First MOT pass rate (age 3) | 86.9% | 88.9% |
| Average defects per test | 1.93 | 1.49 |
| Typical annual mileage | 7,425 mi | 7,534 mi |
| MOT tests analysed | 5,030,361 | 2,134,968 |
| Vehicles tracked | 521,608 | 249,471 |
Pass Rate and Score, Year by Year
| Year | Nissan Qashqai pass (score) | Ford Kuga pass (score) | Stronger |
|---|---|---|---|
| 2010 | 71.5% (419) | 75.0% (522) | Ford Kuga |
| 2011 | 72.9% (417) | 76.4% (514) | Ford Kuga |
| 2012 | 73.8% (413) | 77.6% (522) | Ford Kuga |
| 2013 | 75.9% (439) | 82.3% (623) | Ford Kuga |
| 2014 | 81.1% (552) | 83.3% (605) | Ford Kuga |
| 2015 | 82.9% (556) | 84.8% (603) | Ford Kuga |
| 2016 | 84.2% (545) | 86.2% (602) | Ford Kuga |
| 2017 | 86.1% (544) | 88.2% (612) | Ford Kuga |
| 2018 | 86.6% (542) | 87.8% (575) | Ford Kuga |
| 2019 | 88.4% (566) | 87.8% (547) | Nissan Qashqai |
| 2020 | 90.2% (574) | 88.9% (592) | Ford Kuga |
Shared years only. Nissan Qashqai data also covers 2021-2022; Ford Kuga data also covers 2021-2022, covered in the full year-by-year guides below.
What Actually Fails on Each
Recorded defects and advisories per 100 MOT tests by DVSA inspection category, 2010-2020. A test can record more than one defect.
Nissan Qashqai
- Tyres, wheels and suspension: 73.4 per 100 tests typically around 63,500 miles
- Brakes: 40.0 per 100 tests typically around 62,500 miles
- Other: 16.1 per 100 tests typically around 63,500 miles
- Lights and electrics: 15.6 per 100 tests typically around 70,500 miles
- Visibility (wipers, washers, windscreen): 12.6 per 100 tests typically around 66,000 miles
Ford Kuga
- Tyres, wheels and suspension: 59.7 per 100 tests typically around 58,500 miles
- Brakes: 31.7 per 100 tests typically around 55,500 miles
- Other: 14.6 per 100 tests typically around 58,500 miles
- Lights and electrics: 13.2 per 100 tests typically around 67,000 miles
- Visibility (wipers, washers, windscreen): 8.7 per 100 tests typically around 60,500 miles
The Best Year to Buy Each
Reliability scores are age-adjusted: each year is judged against other cars of the same age. So when an older year out-scores a newer one, it means it holds up unusually well for its age, not that it will need less work than a much newer car. How our scores work.
Why Does the Ford Kuga Come Out Ahead?
The gap between these two isn't a rounding error. The Kuga posts a meaningfully higher pass rate than the Qashqai across the shared years, and the defects-per-test figure tells the more useful story: the average Qashqai picks up close to a third more faults per MOT than the average Kuga. That's not one bad category dragging the average down. It's a broader pattern of the Qashqai throwing up more issues, more often, across most of its life.
Both cars cover almost identical annual mileage, so this isn't a case of one being driven harder than the other. Owners use them the same way: as family transport doing a similar mix of school runs, commutes and weekend trips. When usage is this closely matched, the reliability gap comes down to the cars themselves rather than how they're driven, and here the data is unambiguous. The DVSA MOT data backs this up year after year rather than in a single odd batch.
What Do the Defect Patterns Actually Mean for a Buyer?
Tyres, wheels and suspension is the top defect category for both cars, which is normal for this class of vehicle. They're heavier than a hatchback and many spend their lives on urban roads dodging speed bumps and potholes. But the rate on the Qashqai is well above the Kuga's, and it's not marginal. If you're buying either car, budget for tyres and suspension components as the most likely near-term expense, and get the suspension checked properly on a Qashqai before you buy, since it's clearly the weaker point.
Brakes follow the same pattern: the Qashqai's rate is meaningfully higher than the Kuga's. Combined with the tyre and suspension figures, this suggests the Qashqai's underpinnings simply wear or get neglected more than the Kuga's do, whether that's down to component durability, service intervals being skipped, or the sheer volume of Qashqais on the road diluting the average with more poorly-maintained examples. Either way, a pre-purchase inspection focused on brakes and suspension is money well spent on a used Qashqai.
One area worth flagging for the Kuga: it's the only one of the two with emissions and leaks appearing as a notable category, likely down to the diesel-heavy engine range Ford offered through this period. It's a minor category next to tyres and brakes, but worth a look if you're eyeing an early diesel Kuga.
Which Years Should You Buy or Avoid?
Both cars tell a similar story early on: the 2010-2012 model years are the weak point for each, with the Qashqai's early scores particularly poor and only really turning a corner from 2014 onwards. The Kuga's early years are stronger than the Qashqai's equivalent years, but it also improves sharply from 2013, which lines up with Ford's facelift and engine updates around that time.
For the Qashqai, the sweet spot is 2019-2020, with 2020 standing out as the strongest year in the shared window. For the Kuga, 2017 is the standout, holding up unusually well for its age and outscoring even the newer 2018 and 2019 examples in this dataset. It's a genuine value pick if you find a well-kept one, though a seven-year-old car still needs the usual age-related checks regardless of its strong score.
If you're shopping either model, don't buy on badge alone. Check the specific year and get a full history report. We've broken down every year in more detail in our full Nissan Qashqai year-by-year breakdown and our full Ford Kuga year-by-year breakdown, both worth reading before you commit to a specific plate.
Which One Suits Your Kind of Ownership?
If your priority is minimising MOT stress and you don't care much about how the car drives, the Kuga is the more sensible buy based on this data. It fails less often, picks up fewer defects per test, and its strong years (particularly 2017) are genuinely solid. It's also worth noting the Kuga's smaller sample size reflects fewer cars sold than the Qashqai, so choice on the used market will be narrower, especially for specific trims and years.
The Qashqai still makes sense if you value the deeper used stock, wider dealer network, and the fact that nearly every mechanic and specialist in the country has seen a thousand of them. Its first-MOT pass rate is close to the Kuga's, so it starts life reasonably well. The problem is how much more it degrades by mid-life compared with the Kuga. If you buy one, budget more for brakes, tyres and suspension work, and lean toward the newer end of the range where possible.
Running costs and insurance also play into this. Neither car is expensive to insure by SUV standards, but the Kuga's stronger mechanical record should mean fewer surprise bills over a typical ownership period, something RAC breakdown data trends for this class of vehicle would broadly support.
Frequently Asked Questions
Is the Nissan Qashqai more reliable than the Ford Kuga?
No. Across shared model years 2010-2020, the Ford Kuga has a higher pass rate and fewer defects per MOT test than the Nissan Qashqai, based on over 7 million combined MOT records.
Which Nissan Qashqai years should you avoid?
The 2010-2012 Qashqai years score lowest in this dataset, with pass rates well below the model's later average. Reliability improves markedly from 2014, and 2020 is the strongest year in the shared window.
Which Ford Kuga years should you avoid?
The 2010-2012 Kuga years are the weakest, though still ahead of the equivalent Qashqai years. 2017 is the standout year for the Kuga, scoring higher than even the newer 2018 and 2019 examples.
Does the Kuga cost more to run than the Qashqai?
Both cover similar annual mileage, so usage patterns are comparable. The Kuga's lower defect rate suggests fewer unexpected repair bills over time, though parts and servicing costs vary by trim and engine on both cars.
Which is better as a first car for a new driver?
Neither is a typical first car choice given their size and insurance groups, but if forced to pick, the Kuga's stronger reliability record makes it the lower-risk option for a less experienced owner unfamiliar with spotting early wear.
Our Verdict
A reliable model is only half the story. The exact Nissan Qashqai or Ford Kuga you are looking at could be clocked, on outstanding finance, or a past write-off. Check the specific car before you commit.
Numbers like these only tell you the general pattern. The specific car you're looking at could buck the trend entirely. Before you hand over a deposit on either a Qashqai or a Kuga, run its plate through PlateInsight for its full MOT history, defect record and mileage trend. New users get 5 free credits to check exactly that.
You might also like
Check Any Vehicle's Full History
MOT results, mileage timeline, AI health score, and market valuations. New users get 5 free credits.