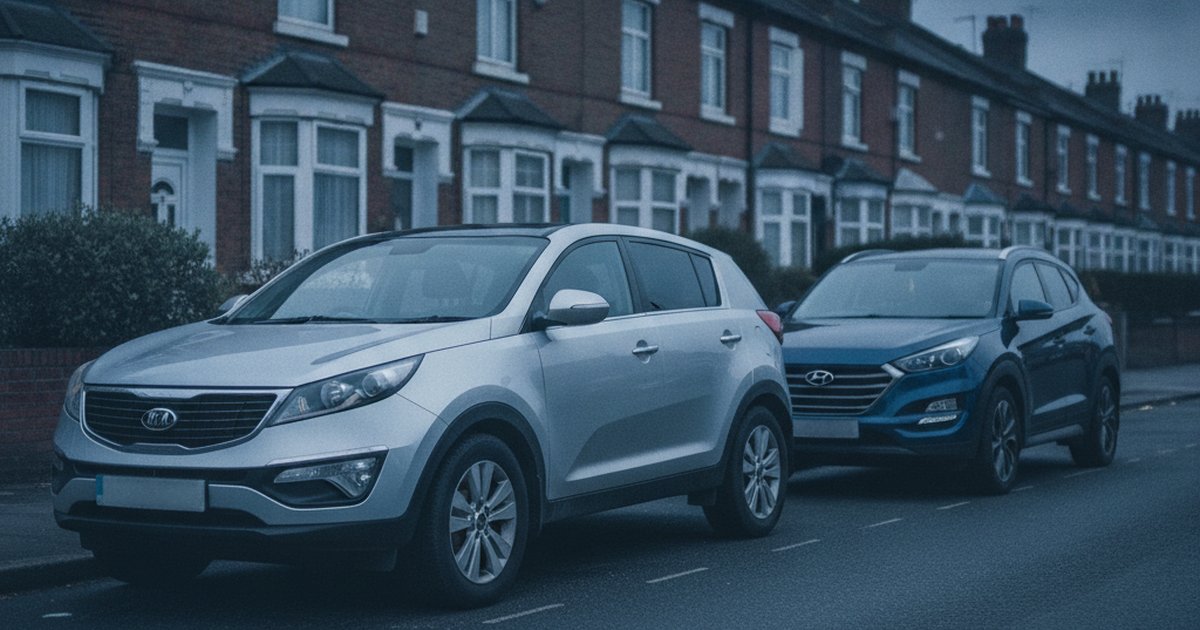
The Kia Sportage and Hyundai Tucson share so much engineering that owners' forums argue for pages about which platform quirks belong to which badge. Same parent company, same Korean-built engines and gearboxes in many trims, similar chassis architecture, and famously long warranties (seven years for the Kia, five for the Hyundai). On paper it should be a coin flip. We pulled 2,010,711 MOT tests across both models from 2010 to 2021 to see if the data agrees.
It doesn't, not quite. The two cars are close, closer than most rival pairings we've looked at, but one comes out ahead consistently enough that it's worth naming a winner rather than shrugging and calling it even.
The short version: The Hyundai Tucson beats the Kia Sportage on our reliability score by 18 points, backed by a 1.7 percentage point higher pass rate and fewer defects per test. Both cars share roughly the same annual mileage, so the gap comes down to how each generation was built and specced, not how hard owners drove them.
The Data Verdict
The Hyundai Tucson is the more reliable car, by 18 points
Like-for-like comparison across the years both cars were on sale (2010-2021), from 2,010,711 real DVSA MOT tests. Scores out of 1000, higher is better.
Head-to-Head: The Numbers (2010-2021)
| Metric | Kia Sportage | Hyundai Tucson |
|---|---|---|
| Reliability score (/1000) | 523 | 541 |
| MOT pass rate | 84.3% | 86.0% |
| First MOT pass rate (age 3) | 85.6% | 86.9% |
| Average defects per test | 1.46 | 1.34 |
| Typical annual mileage | 7,572 mi | 7,545 mi |
| MOT tests analysed | 1,308,540 | 702,171 |
| Vehicles tracked | 195,632 | 113,057 |
Pass Rate and Score, Year by Year
| Year | Kia Sportage pass (score) | Hyundai Tucson pass (score) | Stronger |
|---|---|---|---|
| 2010 | 76.8% (561) | 75.9% (523) | Kia Sportage |
| 2015 | 81.5% (502) | 83.1% (541) | Hyundai Tucson |
| 2016 | 83.8% (536) | 85.0% (565) | Hyundai Tucson |
| 2017 | 85.7% (539) | 86.5% (558) | Hyundai Tucson |
| 2018 | 86.4% (536) | 86.8% (540) | Even |
| 2019 | 86.4% (499) | 87.0% (507) | Even |
| 2020 | 86.3% (442) | 86.8% (457) | Hyundai Tucson |
| 2021 | 86.9% (441) | 86.2% (422) | Kia Sportage |
Shared years only. Kia Sportage data also covers 2011-2014, 2022; Hyundai Tucson data also covers 2022, covered in the full year-by-year guides below.
What Actually Fails on Each
Recorded defects and advisories per 100 MOT tests by DVSA inspection category, 2010-2021. A test can record more than one defect.
Kia Sportage
- Tyres, wheels and suspension: 98.9 per 100 tests typically around 56,500 miles
- Brakes: 64.2 per 100 tests typically around 56,500 miles
- Other: 22.7 per 100 tests typically around 56,500 miles
- Lights and electrics: 17.9 per 100 tests typically around 64,000 miles
- Visibility (wipers, washers, windscreen): 17.7 per 100 tests typically around 60,000 miles
Hyundai Tucson
- Tyres, wheels and suspension: 59.2 per 100 tests typically around 44,000 miles
- Brakes: 35.5 per 100 tests typically around 45,000 miles
- Other: 13.3 per 100 tests typically around 44,000 miles
- Visibility (wipers, washers, windscreen): 7.7 per 100 tests typically around 44,000 miles
- Lights and electrics: 3.8 per 100 tests typically around 46,000 miles
The Best Year to Buy Each
Reliability scores are age-adjusted: each year is judged against other cars of the same age. So when an older year out-scores a newer one, it means it holds up unusually well for its age, not that it will need less work than a much newer car. How our scores work.
Why Does the Tucson Edge Out the Sportage?
The overall numbers put the Tucson ahead, and the defect data explains a good chunk of why. The Tucson picks up fewer issues per test than the Sportage, and the gap is widest in the tyres, wheels and suspension category, by far the biggest defect generator for both cars. The Sportage's rate here is a lot higher than the Tucson's, even though the two models are mechanically closer than almost any other pairing sold in this period.
Some of that comes down to trim mix and wheel sizes fitted across the UK range over the years. Some of it probably reflects real differences in suspension bushings and geometry tuning between the two badges, since Hyundai and Kia's UK cars aren't always specced identically despite sharing a platform. Brakes tell a similar story: the Sportage has a noticeably higher defect rate here too. None of this makes the Sportage a bad car. Its pass rate is still solid for an SUV. But the Tucson is the easier car to live with when MOT time comes around.
Annual mileage is almost identical between the two, both sit around 7,500 miles a year, so this isn't a case of one model being driven harder. The difference is built into the cars themselves.
What Do the Defect Patterns Actually Mean for Buyers?
Look past the headline categories and the story sharpens. Tyres, wheels and suspension dominates both cars' fault sheets, which is normal for a family SUV carrying extra weight and higher ride heights than a hatchback. But the size of the gap between the two here is the biggest single differentiator in this whole comparison. If you're buying a used Sportage, budget for suspension components (arms, bushes) and tyre wear, especially past 55,000-60,000 miles, which is roughly where these defects start clustering in the data.
The Tucson's faults show up at slightly lower mileages on average, but at a lower rate overall. That's the trade-off worth understanding before you buy either car.
So Which One Should You Buy?
If you're choosing between a used Sportage and a used Tucson with similar age, mileage and price, the data gives a mild but clear nudge towards the Tucson. It's not a landslide. An 18-point reliability gap and 1.7 percentage points on pass rate matter, but they won't turn a well-maintained Sportage into a bad buy or a neglected Tucson into a good one.
What matters more is the individual car's history. Check the MOT record for repeated advisories on suspension and tyres before you commit, whichever badge is on the boot. A Sportage with a clean suspension history is a better bet than a Tucson that's been limping through advisories for three years running.
Frequently Asked Questions
Is the Hyundai Tucson more reliable than the Kia Sportage?
According to our MOT data across 2,010,711 tests from 2010 to 2021, yes. The Tucson scores 18 points higher on our reliability index and has a 1.7 percentage point higher pass rate, mostly thanks to fewer suspension and brake defects.
Why does the Sportage have more suspension defects than the Tucson?
It's likely a mix of trim and wheel-size differences across UK model years plus genuine differences in suspension bushing and geometry tuning between the two badges, even though they share a platform. Hyundai and Kia don't always spec their UK-market cars identically.
At what mileage do these defects start appearing?
Suspension and tyre defects on the Sportage start clustering around 55,000 to 60,000 miles in our data. The Tucson's faults appear at slightly lower average mileages but at a lower overall rate.
Do Sportage and Tucson owners drive similar mileages?
Yes, both average around 7,500 miles a year, so the reliability gap isn't down to one model being driven harder than the other.
Our Verdict
The Tucson wins this one, but not by a landslide. It's a consistent, moderate edge built mainly on fewer suspension and brake defects, not some enormous quality gulf. If you already prefer one badge's styling, warranty terms, or dealer network, that preference is a perfectly reasonable tiebreaker. But if you're purely going on reliability data, the Tucson is the safer statistical bet, and the tyres, wheels and suspension category is where you should focus your pre-purchase inspection on either car.
A reliable model is only half the story. The exact Kia Sportage or Hyundai Tucson you are looking at could be clocked, on outstanding finance, or a past write-off. Check the specific car before you commit.
Two cars built from the same bones, and yet the MOT data still finds a gap between them. That's the sort of thing spec sheets and brochures never tell you. If you're cross-shopping either model, run the exact registration through PlateInsight before you hand over any money, because averages tell you what to expect, not what you're actually buying.
You might also like
Check Any Vehicle's Full History
MOT results, mileage timeline, AI health score, and market valuations. New users get 5 free credits.